As I’ve illustrated in a number of posts, Mathematica is developing a number of useful and relatively easy way to construct maps. One of the most frustrating issues with the implementation is that the default latitude tick marks are not in degrees (along with the ever-present problem that they have no idea how long a tick mark should be in a quality plot). In this post I describe a simple function to create tick marks for the Mercator projection maps, and the code is relatively easily generalized to work with other projections.
[If you simply want correct ticks and don’t care about the map projection, select the “Equirectangular” projection and use Mathematica’s default frame ticks. Map ticks are correct for that projection (only). If you need to use a more traditional map projection, read on – CJA, 12 Oct, 2023.]
GeoGraphics – Incorrect Ticks Marks
Let’s start with a simple map of the location of the 2015 Nepal (Gorkha) Earthquake.
(* set up the earthquake information *)
cat = {607208674, "CSEM", "2015-04-25", "06:11:26.30", 28.28, 84.79,
" ", "", "GCMT", "MW", 7.9};
eloc = {#[[5]], #[[6]], #[[11]]} & /@ {cat}
eqradius[m_] := N[10^(0.5*m - 2.25)]
scaleFactor = 1;
(* plot the map *)
GeoGraphics[{Polygon[Entity["Country", "Nepal"]],
GeoStyling[Opacity[0.25], EdgeForm[Black], FaceForm[Red]],
GeoDisk[{#[[1]], #[[2]]}, (scaleFactor*Quantity[eqradius[#[[3]]], "km"]) ] & /@ eloc},
GeoRange -> {{26.25, 29.75}, {82.5, 88.5}}, Frame -> True,
FrameTicks -> {Automatic, Automatic},
BaseStyle -> {18, FontFamily -> "Helvetica"},
PlotLabel -> Style["Gorkha, Nepal Earthquake, 2015-04-25 06:11:26.30 UTC, Mw 7.9", {16}],
GeoZoomLevel -> 8, FrameStyle -> AbsoluteThickness[1.2],
GeoScaleBar -> {"Imperial", "Metric"},
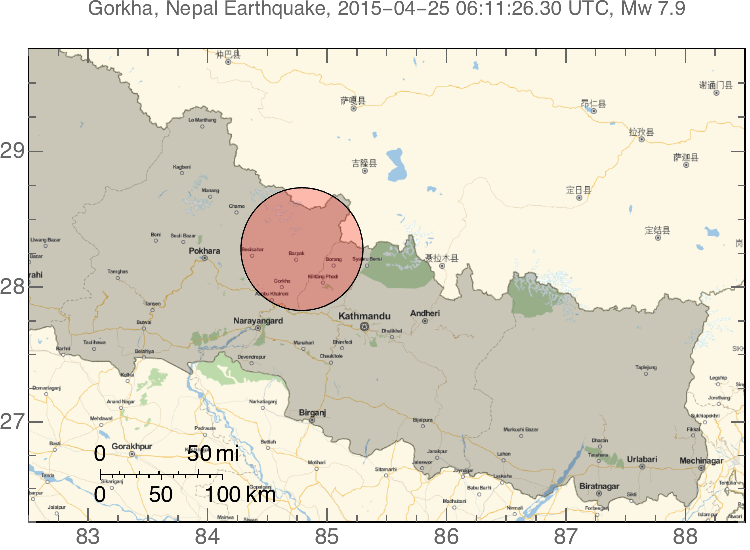
ImageSize -> 600] // PrintHere is the output

Mathematica map of the 2015 Nepal earthquake epicenter plotted with the default FrameTicks. Those are not latitudes on the vertical axis.
The map looks pretty good, but those are not latitude tick marks. Worse yet, in this example, they happen to be close enough to actual latitudes that they could fool you. The latitude of the center of the red circle is 28.28N, the tick marks lead you to believe the location is at roughly 29.5N. Technically, the tick marks are not wrong, they are simply in the practically useless transformation coordinate system. To get the correct tick marks, you need to specify them yourself, convert to projection coordinates, and label appropriately.
GeoGraphics – Correct Ticks Marks
I am going to fix this by writing a function to compute the tick marks in a function, then pass them to the GeoGraphics function. Although the longitude tick marks are correct (for the Mercator Projection), Mathematica’s tick mark lengths, as always, are horribly too short, so we might as well fix that too. I use the convenient projection function, GeoGridPosition, to convert from my tick locations to the projection coordinates. Here’s the function to produce lists of tick marks that can be passed to FrameTicks in the GeoGraphics call.
(* WESN define the box, [j,i]tspacing -> major and minor tick spacing *)
CJAGetLatitudeTicks[w_, e_, s_, n_, jtspacing_:1, itspacing_:0.25, ticklength_:0.02] :=
  Module[{left, right, i},
  left = Join[
    Table[{N[GeoGridPosition[GeoPosition[{i, w}], "Mercator"]][[1]][[2]], i, {ticklength, 0.0}},
        {i, s, n, jtspacing}],
    Table[{N[GeoGridPosition[GeoPosition[{i, w}], "Mercator"]][[1]][[2]], "", {ticklength/2, 0.0}},
        {i, s, n, itspacing}]
    ];

  right = Join[
    Table[{N[GeoGridPosition[GeoPosition[{i, e}], "Mercator"]][[1]][[2]], "",{ticklength, 0.0}},
         {i, s, n, jtspacing}],
    Table[{N[GeoGridPosition[GeoPosition[{i, e}], "Mercator"]][[1]][[2]], "",{ticklength/2, 0.0}},
          {i, s, n, itspacing}]
    ];

  {left, right}
  ]
(**)
CJAGetLongitudeTicks[w_, e_, s_, n_, jtspacing_:1, itspacing_:0.25, ticklength_:0.02] :=
Module[{bottom, top, i},
  bottom = Join[
    Table[{N[GeoGridPosition[GeoPosition[{s, i}], "Mercator"]][[1]][[1]], i, {ticklength, 0.0}},
       {i, w, e, jtspacing}],
    Table[{N[GeoGridPosition[GeoPosition[{s, i}], "Mercator"]][[1]][[1]], "", {ticklength/2, 0.0}},
        {i, w, e, itspacing}]
    ];

  top = Join[
    Table[{N[GeoGridPosition[GeoPosition[{n, i}], "Mercator"]][[1]][[1]], "", {ticklength, 0.0}},
         {i, w, e, jtspacing}],
    Table[{N[GeoGridPosition[GeoPosition[{n, i}], "Mercator"]][[1]][[1]], "", {ticklength/2, 0.0}},
         {i, w, e, itspacing}]
    ];

  {bottom, top}
  ]
I use the Join function and two calls to Table to create the major and minor tick marks in one list. The only difference between the left and right (or top and bottom) ticks are the labeling of the major tick marks. Minor tick marks are half the length of major tick marks. You call the above functions first to generate lists latTicks and lonTicks, then pass those to GeoGraphics. For example
latTicks = CJAGetLatitudeTicks[82, 89, 25, 31];
lonTicks = CJAGetLongitudeTicks[82, 89, 25, 31];

GeoGraphics[{Polygon[Entity["Country", "Nepal"]],
  GeoStyling[Opacity[0.25], EdgeForm[Black], FaceForm[Red]],
  GeoDisk[{#[[1]], #[[2]]}, (scaleFactor*Quantity[eqradius[#[[3]]], "km"]) ] & /@ eloc},
  GeoRange -> {{26.25, 29.75}, {82.5, 88.5}}, Frame -> True,
  FrameTicks -> {latTicks, lonTicks},
  BaseStyle -> {18, FontFamily -> "Helvetica"},
  PlotLabel -> Style["Gorkha, Nepal Earthquake, 2015-04-25 06:11:26.30 UTC, Mw 7.9", {16}],
  GeoZoomLevel -> 8, FrameStyle -> AbsoluteThickness[1.2],
  GeoScaleBar -> {"Imperial", "Metric"},
  ImageSize -> 600] // Print
The only change from the above is in the FrameTicks option. The result is a correctly labeled and more acceptable length tick marks.
Mathematica map of the 2015 Nepal earthquake epicenter plotted with custom FrameTicks. Those are latitudes on the vertical axis.
You can see that the tick marks reflect the correct epicenter (the circle) position.
Summary
Mathematica can be used to make some nice maps, but as is often the case with this tool, the tick marks are a source of frustration. Of course you can usually figure out a work around, if you have the time. Hopefully, Wolfram will fix this annoyance in a future version of the application.