Category Archives: Platinum

Evaluating Surface Energy Calculations of Pt(111) for Different Slab Model Parameters.

By Stephen Holoviak

This post will attempt to calculate the surface energy of the Pt(111) surface using a slab model and plane wave DFT calculations. Slab models were constructed using different cell parameters, such as number of layers, vacuum spacing and size of supercell. The surface energy for these models was calculated and compared to other models and experimental results.

Introduction:

The existence of a surface on a solid will increase the energy of the atoms at the surface when compared with those atoms in the bulk of the crystal due to the change in coordination atoms at the surface experience. Surfaces can be approximated in DFT calculations through the creation of slab models. The energy of these surfaces, \sigma, can be calculated with the following equation, where A is the total surface area of the slab, and E is the system energy of the slab and bulk respectively, and n is the number of atoms in the slab model.

\sigma = \frac{1}{A}[E_{slab} - nE_{bulk}] (1)

Experimentally, the surface energy of Pt(111) is found to be 0.159 [\frac{eV}{\r{A}}](2)

Since the experimental value of the surface energy is fairly small, all calculations were converged to a limit of 5E-3[eV], this limit is depicted on the graphs testing convergence by a red line.

Calculations:

Functional: GGA-PBE(3)

Pseudopotential: “On the fly generation” of ultrasoft psuedopotentals in CASTEP(4) for Pt with the following parameters:

  • Core Radius: 2.4[Bhor] ~=1.27[Å]
  • 32 electrons in valance with (4f14 5s2 5p6 5d9 6s1) configuration.

All k-points assigned with a Monkhorst-Pack method (5).

1-Layer Slab:

In an attempt to model a platinum surface, a slab model with 1 layer of Pt(111) atoms and 10[Å] of vacuum spacing was constructed.

Convergence with respect to the cutoff energy was calculated with a fixed (8x8x1) k-point mesh. The energy of the calculations were then compared to the previous calculation to find the difference. The level of convergence for the cutoff energy was within the previously described limit, which is off of the scale of the graph, indicated by the arrows under the line.

The calculations were found to be well converged for all cutoff energies above 450[eV].

Convergence with respect to the k-point mesh was calculated with a fixed energy cutoff of 450[eV]. The energy of the calculations were then compared to the previous calculation to find an energy difference.

A 1 atom slab of molecules is a very unstable system and not an ideal way to model a surface. Because of this instability changing the number of k-points included in the calculation always changed the energy of the system significantly. There was no consistent value of energy found with sufficient # of k-points.

The number of k-points in the vacuum direction was also increased, generating 8x8x2 and 8x8x4 meshes, to test the effect on the calculations, however there was no effect, changing the slab energy by less than 1E-4[eV].

The amount of vacuum space was also increased from 10[Å] to 20[Å] to test the effect on the calculation, however there was no effect , changing values of slab energy by less than 1E-4[eV].

5-Layer Slab:

A slab model with five layers of Pt(111) and 10[Å] of vacuum space was constructed. This model should represent a solid much better than the 1 layer model.

Convergence for number of k-points and cutoff energy was tested in the same way as the 1 layer model (see figures below). At cutoff of 550[eV] and a k-point mesh of 16x16x1 the calculations were found to be converged to within 5E-3[eV]. The energy of the slab was calculated with these parameters.

\sigma = (\frac{1}{53.3323[A^2]})(-65253.5044[eV] - 5*-13050.9532[eV] ) = 0.024[eV]

The energy of the bulk crystal was then calculated using the same cutoff and a 16x16x16 k-point mesh. Using the calculated energies, the area of the slab, and n = 5 for our slab, the surface energy was found to be 2.4E-2[eV]. This value is much smaller than the experimental value of 0.159[eV].


In order to find the source of this discrepancy, the calculations were repeated for a larger slab with 5 layers, spanning 2×2 and 3×3 unit cells. The surface energies calculated for these cells were similar to the original model, changing only on the order of 1E-3[eV] in final energy.

Changes to the amount of vacuum space were also made to the model and found to have no significant effect on the calculated surface energy, changing the value on the order of 1E-5.

Another attempt to improve the surface energy calculation for this model was to change the functional from the GGA PBE to the LDA CA-PZ(6, 7). It was reported in Vitos (8) that when compared to LDA, GGA predicts surface energies 7-16% lower, and when compared to experimental results predicts values up to 29% lower. The reasoning for this is described as the GGA functional underestimating the exchange energy. When the LDA functional was used for the calculations the surface energy was calculated as 3.4E-2[eV].

\sigma = (\frac{1}{53.3323[A^2]})(-65306.89886[eV] - 5*-13061.74095[eV] ) = 0.034[eV]

This value is a significant improvement over the GGA value, however it is still only a quarter of the experimental value.

8-Layer Slab:

The final attempt to improve the calculated surface energy was done by constructing an 8-layer slab with 10[Å] of vacuum space. The calculations were tested for convergence by the same method as the 1 and 5 layer models. The surface energy calculated with 550[eV] cutoff, 16x16x1 k-point mesh, and LDA CA-PZ functional was 3.4E-2 [eV]. This result is comparable to that of the 5-layer slab.

\sigma = (\frac{1}{53.3323[A^2]})(-104492.1244[eV] - 8*-13061.74095[eV] ) = 0.034[eV]

The vacuum space was changed to 20[Å] in order to test the effects on the calculations. An insignificant shift in energy on the order of 1E-4 [eV] was found.

The supercell size was also changed to 2×2 to test the effects on the calculations. The surface energies calculated for these cells were similar to the original model, changing only on the order of 1E-3[eV] in final energy.

Conclusion:

In order to calculate the surface energy of a metal a common approach is to use slab models. This post found 5-layer and 8-layer slab models resulted in essentially the surface energy. A 1-layer model was found to be a very unstable system and poor physical model. A 10[Å] vacuum spacing was found to be sufficient for all of the slabs tested, and increasing the vacuum spacing had no effect on the calculated energies. It was also demonstrated that the GGA PBE functional underestimates the surface energy more so than the LDA CA-PZ functional.

All models tested significantly underestimated the value of the surface energy when compared to the experimental results. The source of this error is currently unknown.

References:

(1) Sholl, D.S. Steckel, J.A. (2009) “Density Functional Theory: A Practical Introduction.” Wiley, 96-98.

(2) Miedema, A.R. (1978). “Surface energies of solid metals”. Zeitschrift fuer Metallkunde, 69(5), 287-292.

(3) Perdew, J. P. Burke, K. & Ernzerhof, M.  (1996) “Generalized Gradient Approximation Made Simple.” 3865–3868.

(4) Clark, S.J., et. al.(2005)”First principles methods using CASTEP”, Zeitschrift fuer Kristallographie 220(5-6) pp. 567-570

(5) Monkhorst, H.J. Pack, J.D. (1976) “Special points for Brillouin-zone integrations.” Physical Review B, 13(12), 5188-5192

(6) Ceperley, D. M. Alder, B. J. “Ground State of the Electron Gas by a Stochastic Method”, Phys. Rev. Lett., 45, 566-569 (1980)

(7) Perdew, J. P. Zunger, A. “Self-interaction correction to density-functional approximations for many-electron systems”, Phys. Rev. B, 23, 5048-5079 (1981).

(8) Vitos L. et. al. (1998) “The surface energy of metals.” Surface Science, 411(1-2), 186-202

By Stephen Holoviak.

This post will overview an attempt to predict the structure of platinum crystals. Calculations were made of the energy of Pt crystals in three different crystal structures: simple cubic (sc), face-centered cubic (fcc), and hexagonal close-packed (hcp). The lattice parameters of the crystals were varied and the number estimate 0[K] energy was calculated using the CASTEP[1] implementation in Materials Studio.

Calculations:

Functional: GGA-PBE[2]

Pseudopotential: OTFG ultrasoft

  • Core Radius: 2.4[Bhor] ~=1.27[Å]
  • 32 electrons in valance with (4f14 5s2 5p6 5d9 6s1) configuration.

Cutoff Energy: 350[eV]

# k-points: 8x8x8

Testing for Convergence:

Cutoff Energy:

To ensure the calculations were well converged, tests were run on the experimentally observed fcc structure. The default Pt structure was loaded into materials studio with an fcc structure and a lattice parameter of 3.9239[Å]. First, the cutoff energy was varied using the default 6x6x6 set of k-points.

The calculations were found to be well converged, with crystal energies within 0.05[eV] of each other, at cutoff energy of 350[eV] or higher. The number of k points being used in the calculation was then evaluated for convergence, using the 350[eV] cutoff energy and varying the number of k-points being used.

# of k-points:

The calculations were found to be well converged, within 0.05[eV] of calculated crystal energy of each other, for a minimum of 8x8x8 k-points.

Structure Calculations:

Simple Cubic:

In order to determine the lattice constant for the simple cubic structure, the energies of several initial estimates were found. The data from these estimates were then fitted to a 2nd-degree polynomial and the minimum value was found. Several more lattice parameters were tested on and around this minimum. These energies were then fitted to another 2nd-degree polynomial and another minimum was calculated. The energy of the structure was then calculated at this minimum. Since the energy differences between calculations after two iterations are well below the energy difference used to determine convergence the iterations were stopped here.

The minimum energy lattice parameter was found to be at a = 2.62[Å] with an energy of -13050.541[eV]. 

Face Centered Cubic:

Determining the lattice constant for the face-centered cubic crystal was very similar to finding the sc lattice constant. The energies of several initial estimates were found. The data from these estimates were then fitted to a 2nd order polynomial and the minimum value was found. Several more lattice parameters were tested on and around this minimum. These energies were then fitted to another 2nd-degree polynomial and another minimum was calculated. The energy of the structure was then calculated at this minimum. Since the energy differences between calculations after two iterations are well below the energy difference used to determine convergence the iterations were stopped here.

The minimum energy lattice parameter was found to be at a = 3.97[Å] with an energy of -13050.940[eV].

Hexagonal Close-Packed:

Determining the lattice constant for the hexagonal close-packed crystal had several key differences. The hcp crystal has two lattice constants that must be specified, a and c. The best packing to fill space is a ratio of c/a = 1.633[3], this ratio was fixed in the calculations and all changes were made in terms of the lattice parameter a. Also, the different lengths of the lattice constants mean that the number of k-points must be adjusted to keep a similar sampling density in k-space, for the hcp calculations the number of k-points was adjusted to 8x8x5. Another important adjustment is the fact that the primitive hcp unit cell has two atoms in it, where the sc and fcc cells were primitive, so the calculated 0[k] energies must be normalized per atom in order to compare them to the previous calculations. After these changes were made, the energies of several initial estimates were found. The data from these estimates were then fitted to a 2nd order polynomial and the minimum value was found. Several more lattice parameters were tested on and around this minimum. These energies were then fitted to another 3rd degree polynomial and another minimum was calculated. The energy of the structure was then calculated at this minimum. Since the energy differences between calculations after two iterations are well below the energy difference used to determine convergence the iterations were stopped here.

The minimum energy lattice parameters were found to be a = 2.81[Å], c = 4.59[Å], with an energy of -13050.87[eV]

Conclusion:

The lowest energy phase of platinum crystals was calculated to be the fcc crystal structure with a lattice constant of 3.97[Å] a summary of all of the calculated results can be seen in the table below.

Structure:Lattice Constant[Å]:Calculated 0[K] Energy[eV]:
Experimental (fcc)3.92N/A
Simple Cubic2.62-13050.54
Face Centered Cubic3.97-13050.94
Hexagonal Close-Packeda = 2.18
c = 4.59
-13050.87

The experimentally determined structure for platinum is the fcc crystal structure with a lattice constant of 3.92[Å][4], which is slightly smaller than the lattice constant calculated.


References:

1.) “First principles methods using CASTEP”, Zeitschrift fuer Kristallographie 220(5-6) pp. 567-570 (2005) S. J. Clark, M. D. Segall, C. J. Pickard, P. J. Hasnip, M. J. Probert, K. Refson, M. C. Payne

2.) “Generalized Gradient Approximation Made Simple.”, Perdew, J. P., Burke, K. & Ernzerhof, M. 3865–3868 (1996).

3.)”Density Functional Theory: A Practical Introduction” D. Sholl and J. Steckel, (Wiley 2009)

4.) “Materials Science and Engineering”,  Callister, (Wiley 1994)

Pt Crystal Lattice determination by Castep

by-Hepeng Ye

Crystallography is widely applied to study inorganic molecules, proteins, metals, etc. Such process is driven by entropy and enthalpy at the same time which makes it very tricky to control the crystallization and hard to predict what lattice will a given compound form at certain condition.

Platinum (Pt) metal is studied using Castep through energy minimization. Basic idea behind is that the lowest energy stable should be the most favored state, and that corresponding lattice should be the most likely lattice that we shall expect to observe from experiment. Now, lets pretend that we do not know what is the crystal lattice for Pt, and I will show you how to find out the more likely lattice.

Energy calculation involves GGA-PBE functional[1], and pseudo-potentials were set as default as OTFG ultrasoft[2]. And the ultrasoft pseudopotential for Pt is set to have core radii to be 2.403 Bohr radii (~1.27Å), vis using valence electrons in the 4f14 5s2 5p6 5d9 6s1 configuration.

Two lattices are studied, face center cubic(FCC) and hexagonal close packing(HCP), and the following part will present parameters optimization and energy minimization for both lattice.

For FCC, m-3m space group is used since it is the only possible space group, and by using lattice parameter (a) equals 4.0Å, energy cut-off convergence is determined.

Figure1. energy cut-off optimization for Pt FCC

As shown in the figure 1, energy difference converges as I use larger energy cut-off, and the difference between using 420ev cut-off and 480eV are very close. Base on this, I am confident to say that 480eV is a good stop point and larger cut-off may no longer be efficient for DFT calculation.


Then, another parameter optimized is the K-points. I used three cell sizes and all with 480eV cut-off energy. And plot below shows the energy per atom from irreducible K-points from 10 up to 120.

Figure 2. K-points optimization for Pt FCC at three different lattice parameters using optimized energy cut-off.

It is clear that as irreducible k-points used go beyond ~25, energy starts to stabilize, though still fluctuates in a tolerable range. And by considering the computation capability and energy accuracy, I use the irreducible k to be 56 (fourth point from left) as the optimized K-points for further calculation.

Energy cut-off is determined to be 480eV and K-points is 56, then the only parameter left for FCC structure is the cell length. I performed the a-optimization by randomly picking three a values, and do the calculation until energy is minimized for each, then I use these three energies in function of a-values to fit a parabola, and use that as an indication to look for another three a-values on the curve which are likely to give me the minimized energy.

Figure 3. Energy diagram verses lattice parameter using optimized K-points and energy cut-off.

Three iterations are performed and totally nine data points give a nice parabola. And the minimum energy (energy per atom) from the parameter a=3.975Å with corresponding energy to be -13051.00eV(per atom).

For platinum in HCP lattice, D3H-3 space group is used. And to make data from FCC and HCP calculation comparable with each other, energy cut-off is kept the same (480eV). But for D3H-3 space group, k-points need to be re-optimized since the real space and reciprocal space are both different from the fcc.

Figure 4. K-points optimization for Pt HCP lattice structure.

Starting with a equals 3.9Å and a/c ratio being 1.53. k-points are tested from 16 to 312.

Usually, more than 10 K-points should be enough, and it is true from the plot. There is a bump around 40 k-points and as a reason, I choose to use k equals 135 for calculation.

Since HCP has two lengths to be modified, one edge is defined as ‘a’ and another one as ‘c’. We know that in the crystal structure, size matters, and we know the density is a description of how many mass in a certain volume, so similar idea is used here that we analyze the energy of lattice at different pressure (isobaric condition), and for each pressure there should be a corresponding volume, which is a function of ‘a’ and ‘c’. By modifying the ratio of a/c, there should be an optimized (lowest) energy for that specific volume. Eventually, a plot of energy with respect to volumes will be plotted.

Figure 5. Energy diagram for Pt HCP at multiple lattice parameters’ ratios for each specific volume.

The plots above shows: at each volume(Å3), there are 10 a/c ratios evaluated from a/c equals 1.3 to 1.8 (most metal hcp fall into this range).

And by extracting the lowest energy from each volume, the minimum energy is get from the lowest point, to be -13050.24eV per atom.

FCC has minimum energy to be -13051.00 eV

HCP has minimum energy to be -13050.24 eV

So, FCC has lower energy, and should be the expected crystal structure for platinum.

As mentioned at the beginning, after showing the energy difference between these two possible lattice structures, what is the actual structure?

From Crystallography Open Database[3], I could infd the experimental result for Pt is FCC, with lattice parameter ‘a’ to be 3.944+/-0.004Å. The final lattice is fcc which is what we expect.


reference:

[1]:Setting up pseudopotentials- ultrasoft and norm-conserving pseudopotentials.

https://www.tcm.phy.cam.ac.uk/castep/documentation/WebHelp/content/modules/castep/tskcastepsetelecpotentials.htm

[2]:J. P. Perdew, K. Burke, and M. Ernzerhof, Generalized Gradient Approximation Made Simple.
Phys. Rev. Lett. 77, 3865 (1996)

[3]: Entry 1011103, F m -3 m #225, Crystallography Open Database.

http://www.crystallography.net/cod/1011103.html

Determination of the optimal crystal structure of Pt using DFT energy optimization from Simple Cubic, Face-Centered Cubic, and Hexagonal Closed-Packed

by Angela Nguyen

1. Introduction

The purpose of this project is to determine the crystal structure and lattice constant of platinum (Pt) through the usage of Density Functional Theory (DFT) with a plane wave basis set as implemented by the CAmbridge Serial Total Energy Package (CASTEP) module [1] in Materials Studio. Three different crystal structures for Pt will be investigated (simple cubic (sc), face centered cubic (fcc), and hexagonal close-packed (hcp)) and their optimal lattice constants will be calculated. In order to determine which crystal is preferred, the total energy for each optimized crystal structure will be compared, where the crystal structure with the lowest total energy will be the preferred crystal structure. From the DFT calculations, it was determined the optimal lattice constants for the sc and fcc conventional crystal structure were 2.64 Å and 3.97 Å respectively. In terms of the fcc primitive cell, the lattice constant was determined to be 2.80 Å. For the hcp crystal structure, the optimal \(\frac{c}{a}\) was determined to be 1.8 in which the optimal lattice constants were a = 2.72 Å and c = 4.90 Å. The total energy calculated for the sc, fcc, and hcp crystal structure were -8.51 eV/atom, -8.98 eV/atom and -8.91 eV/atom. From this, it was determined that the optimal crystal structure for Pt is the fcc with a lattice parameter  of 3.97 Å.

2. DFT Parameters

Listed below are the parameters used for the optimization of each crystal structure.

Exchange-Correlation Functional TypeGeneralized Gradient Approximations [2]
Exchange-Correlation FunctionalPerdew Burke Ernzerhof [3]
Relativistic TreatmentKoelling-Harmon [4]
Psuedopotential"On the fly" generated (OTFG) ultrasoft [5]
K point GridMonkhorst-Pack [6]
SpinUnrestricted

The cutoff radius for the stated pseudopotential is 2.40 Bohr (1.27 Å) with 32 valence electrons in the following configuration 4f14 5s2 5p6 5d9 6s1.

3. Methodology

Using Materials Studio, three different crystal structures for Pt were built and optimized. For the sc and fcc crystal structure, the same optimization method was used as only one lattice parameter is needed to define the structure. The hcp crystal structure required a different optimization method as two lattice parameters are needed to define the crystal structure. In order to systematically vary the two lattice parameters, a ratio \(\frac{c}{a}\) was defined to vary the parameters accordingly.

3.1 sc and fcc Crystal Structure Optimization

3.1.1 Lattice Constant

First, the lattice constant to define each crystal structure was optimized. The lattice constant (\(a\)) was varied between 2.0 – 3.0 Å for the sc crystal structure and between 3.5 – 4.5 Å for the fcc crystal structure. The total energy was recorded for each different lattice constant. To normalize the data, the cohesive energy of each \(a\) was calculated using the atomic psuedopotential energy:

\begin{equation}E_{cos}=\frac{E_{tot}-E_{atomic}}{N_{atoms}}\end{equation}

where \(E_{cos}\) is the cohesive energy, \(E_{atomic}\) is the psuedo atomic energy, and \(N_{atoms}\) is the number of atoms in the cell.

The data was then plotted and fitted to the Birch-Murnaghan (BM) equation of state [7]:

\begin{equation}E_{tot}(a)=E_{0}+\frac{9V_{tot}B_{tot}}{16}{[(\frac{a_{0}}{a})^{2}-1]^{3}}B_{0}^{‘}+[(\frac{a_{0}}{a})^{2}-1]^{2}[6-4(\frac{a_{0}}{a})^{2}] \end{equation}

where \(E_{tot} \) is the total energy, \(V_{0}\) is the equilibrium volume per atom, \(B_{0}\) is the bulk modulus at zero pressure, \(B_{0}^{‘}\) is the partial derivative of B with respect to pressure at constant temperature, \(a\) is the lattice constant, and \(a_{0}\) is the lattice constant corresponding to the minimum energy. To fit the data, \(E_{0}\), \(V_{0}\), \(B_{0}\), \(B_{0}^{‘}\), and \(a_{0}\) were left as fitting parameters which varied depending on the crystal structure. Once the data was fitted, \(a_{0}\) would then correspond to the optimal lattice constant for each crystal structure.

3.1.2 K Points

The k point mesh was varied for each structure in order to ensure convergence of the last optimization of each structure using \(a_{0}\) as the lattice constant. Because the sc and fcc crystal structure have the same lattice constants in all three dimensions, the k point mesh had the form of M x M x M. For each variation of the mesh, the number of irreducible points for was determined and the energy was then recorded. The energy was then corrected using Equation 1.This data was then plotted to determine which k point mesh produced a cohesive energy value that was within 0.01 eV of the energy of the largest k point mesh used, while having the lowest amount of irreducible k points. This mesh would then be used for the final computation of determining the total energy of the system.

3.1.3 Energy Cutoff

The energy cutoff was varied between 200 and 600 eV for each structure in order to ensure convergence of each structure using \(a_{0}\) as the lattice constant. Again, the energy for each energy cutoff point was recorded and corrected using Equation 1. The data was then plotted to determine the lowest energy cutoff needed while still ensuring the calculation was converged. The minimum energy cutoff was chosen by determining which cutoff produced a total energy that was within 0.01 eV of the highest energy, while having the lowest energy cutoff.

3.2 hcp Crystal Structure Optimization

3.2.1 Lattice Constant

The optimization method used for the hcp crystal structure was similar to that of the sc and fcc crystal structure except for varying the lattice constants (\(a\) and \(c\)). Because two lattice constants are needed to define the structure, a ratio of  \(\frac{c}{a}\) was used to vary the lattice constants appropriately, where \(\frac{c}{a}\) varied between 1.6 to 1.9, and \(a\) was varied between 2.5 – 5.0 Å. For each \(\frac{c}{a}\), a plot of cohesive energy versus \(a\) was produced and then fitted to the BM equation of state to determine the \(a_{0}\) for each ratio. The lowest \(a_{0}\) was then chosen as the optimal lattice constant for the hcp crystal structure in which the second lattice parameter was calculated accordingly to the chosen \(a_{0}\)’s respective \(\frac{c}{a}\).

3.2.2 K Points

For the HCP crystal structure, the k point mesh was chosen differently as the unit cell is not cubic. Instead, the mesh had the form M x M x N.

4. Results

Shown below will be the results for the optimization of the sc crystal structure for the lattice constant, k point mesh, and energy cutoff for brevity of this post. Afterwards, a table summarizing the final optimizing parameters for each crystal structure will be given.

Figure 1. Cohesive energy (eV/atom) vs. Lattice constant (Å). The blue circles represents the data points obtained from DFT calculations in Materials Studio. The blue line represents the fitted BM equation of state for the given data set. The red square represents \(a_{0}\), or the minimum of the BM equation of state, that will be used in future optimization calculations. The inset is the magnified portion of the plot around \(a_{0}\), which is 2.64 Å.

Figure 1 represents the plot of the total energy per atom as a function of lattice constant. As expected, the plot shows almost a quadratic relationship between the energy per atom and the lattice constant. The BM equation of state can be used to fit the data points and determine the \(a_{0}\) for the crystal structure. From the fit, \(a_{0}\) for the sc crystal structure is 2.64 Å.

Figure 2. Cohesive energy (eV/atom) vs. Energy cutoff (eV). The blue circles represents the data points obtained from DFT calculations in Materials Studio. The blue line is to help guide the eye across the plot. The black dashed lines represent the +/- 0.01 eV tolerance used to determine the optimal energy cutoff. The red square represents optimal energy cutoff that will be used in future calculations. The inset is the magnified portion of the plot around the optimal energy cutoff, which is 400 eV.

Figure 2 displays a plot of the cohesive energy per atom as a function of the number of irreducible k points as determined by Materials Studio. From the plot, it can be seen that the number of irreducible k points significantly affects the total energy determined from the CASTEP module. If the wrong k point mesh is chosen, then the energy will not be converged and yield an invalid result. From the above plot, the k point mesh chosen for the sc crystal structure was 9 x 9 x 9, corresponding to 365 irreducible k points.

Figure 3. Cohesive energy (eV/atom) vs. Number of irreducible k points. The blue circles represents the data points obtained from DFT calculations in Materials Studio. The blue line is to help guide the eye across the plot. The black dashed lines represent the +/- 0.01 eV tolerance used to determine the optimal number of irreducible k point mesh. The red square represents optimal k point mesh that will be used in future calculations. The inset is the magnified portion of the plot around the optimal k point mesh, which is 9 x 9 x 9.

Figure 3 shows a plot of the total energy per atom as a function of energy cutoff. Again, it is important to choose an appropriate energy cutoff to ensure that the energy given is converged to one’s chosen tolerance, which in this case is 0.03 eV. From the plot, the chosen energy cutoff for the SC crystal structure is 400 eV. To note, this energy cutoff was used for the other two crystal structures as to make sure the same plane waves were used for all calculations. Also, each crystal structure had the same optimal energy cutoff of 400 eV.

Figure 4. Cohesive energy (eV/atom) vs. Lattice constant (Å) for hpc at various \(frac{c}{a}\). The colored circles represent the data points obtained from DFT calculations in Materials Studio where each color is denoted by the legend on the right. The colored lines represent the fitted BM equation of state for each given data set. The red square represents \(a_{0}\), or the minimum of the BM equation of state, that will be used in future optimization calculations, which is 2.72 Å.

Lastly, Figure 4 is a plot summarizing the optimization of the two lattice constants for the hcp crystal structure. From the plot, it can be seen that optimal \(a_{0}\) occurs when \(\frac{c}{a}\) is 1.8. When \(\frac{c}{a}\) is increased to 1.9, the cohesive energy starts to increase again relative to \(a_{0}\).

Below are the optimized crystal structures for Pt as well as a table summarizing the parameters chosen and energy values for each crystal structure. When comparing the energies in the table, it can be seen that the FCC crystal structure has the lowest energy. Thus, the preferred crystal structure for Pt is the FCC crystal structure with a lattice constant of 3.97 Å.

Figure 5. Optimized crystal structures for Pt. a) sc crystal structure. b) fcc crystal structure. c) hcp crystal structure.

Crystal StructureLattice Parameter [Å]K Point MeshEnergy Cutoff [eV]Cohesive Energy [eV/atom]
sc2.649 x 9 x 9400-8.51
fcc3.9711 x 11 x 11400-8.98
hcp2.72
4.90
10 x 10 x 6400-8.91

5. Conclusions

From the above given data, it can be seen that the preferred crystal structure for Pt is FCC with a lattice constant of 3.97 Å. In order to check on how accurate the lattice constant is to experimental values, two different sources were used: 1) Materials Project (a computational  database populated with thousands of inorganic compounds, molecules, etc) and 2) experimental work tabulated by Wiley. The table below lists the lattice constant values for the this project, the Materials Project, and the experimental work.

DFTMaterials Project [8]Experimental [9]
a3.973.983.912

From the table, it can be seen that the value obtained from DFT after optimization is in good agreement with that of Materials Project. This is to be expected, since both values were obtained computationally using the GGA functional. When comparing to the experimental value listed by Wiley, it can be seen that there is a larger difference in values for the lattice constant (0.05 Å) as opposed to the reference computational value. This difference can be attributed to multiple factors such as the computation calculations are done in vacuum and that all crystals were of uniform shape and size. Experimentally, this is not possible as it is difficult to run experiments in vacuum and the shapes of each Pt crystal cannot be controlled. Overall, it can be concluded that the preferred crystal structure for Pt is indeed FCC with a lattice constant of approximately 3.97 Å.

6. References

[1] Clark Stewart J et al., “First principles methods using CASTEP ,” Zeitschrift für Kristallographie – Crystalline Materials , vol. 220. p. 567, 2005.
[2] J. P. Perdew, K. Burke, and M. Ernzerhof, “Generalized Gradient Approximation Made Simple,” Phys. Rev. Lett., vol. 77, no. 18, pp. 3865–3868, Oct. 1996.
[3] J. P. Perdew et al., “Atoms, molecules, solids, and surfaces: Applications of the generalized gradient approximation for exchange and correlation,” Phys. Rev. B, vol. 46, no. 11, pp. 6671–6687, Sep. 1992.
[4] D. D. Koelling and B. N. Harmon, “A technique for relativistic spin-polarised calculations,” J. Phys. C Solid State Phys., vol. 10, no. 16, pp. 3107–3114, Aug. 1977.
[5] D. Vanderbilt, “Soft self-consistent pseudopotentials in a generalized eigenvalue formalism,” Phys. Rev. B, vol. 41, no. 11, pp. 7892–7895, Apr. 1990.
[6] H. J. Monkhorst and J. D. Pack, “Special points for Brillouin-zone integrations,” Phys. Rev. B, vol. 13, no. 12, pp. 5188–5192, Jun. 1976.
[7] F. Birch, “Finite Elastic Strain of Cubic Crystals,” Phys. Rev., vol. 71, no. 11, pp. 809–824, Jun. 1947.
[8] K. Persson, “Materials Data on Pt (SG:225) by Materials Project,” 2015.
[9] W. P. Davey, “Precision Measurements of the Lattice Constants of Twelve Common Metals,” Phys. Rev., vol. 25, no. 6, pp. 753–761, Jun. 1925.

Effect of Coverage on Adsorption Energies

Binding Energies on Surfaces

DFT is routinely used to determine the adsorption energies of different atoms and molecules on metal surfaces. The adsorption energy is simply the change in energy when an atom or molecule is brought from (infinitely) far away from a surface to it’s equilibrium adsorption configuration.

In the case of a single atom X (of a diatomic molecule X2) adsorbing on a surface it is typical to evaluate the adsorption energy as [1]:

\begin{equation}E_{ads} = E_{surf+X} –  0.5E_{X_{2}}-E_{surf}\end{equation}

Adsorption Sites on FCC (111) Metal Surfaces

The (111) surface of FCC crystals (metals) have 4 unique adsorption sites. They are called the atop, fcc hollow, hcp hollow, and bridge site for the surface. They are pictured below convenience.

Fig. 1 Adsorption sites on Pt(111); (left to right) bare surface, atop, fcc, hcp, bridge).

Atoms and molecules tend to preferentially bind to certain sites. This is something we would like to be able to determine. Luckily, (1) is valid for all of these binding sites so we can simply calculate the adsorption energies directly to determine what site an atom/molecule of interest may bind to.

Coverage Effects

When using plane-wave DFT codes, ones must always be aware of mirror images interacting. The distance between mirror images in such DFT calculations depends on the size of the supercell chosen as well as the number of adsorbates in the supercell.

It is common practice to place only 1 adsorbate within a supercell, meaning the supercell size determines the distance between mirror images. Below are figures showing how mirror images of adsorbates might “see” one another and how the distance between mirror images changes with supercell size.

Fig 2. Two 2×2 supercells of an O atom adsorbed on Pt(111). (The indicated distance is in Angstrom)

Fig 3. Two 3×3 supercells of an O atom adsorbed on Pt(111). (The indicated distance is in Angstrom).

The above figures help us infer that adsorption energies might decrease (adsorption more favorable) with increasing supercell size. This is consistent with the idea that most interactions between atoms fall off pretty rapidly with distance (e.g. vdW).

We investigate this by comparing the adsorption energies of an O atom adsorbed on the atop, fcc, hcp, and bridge sites of  Pt(111) using two different sized supercells, (2×2) and (3×3). These correspond to 1/4=0.25 ML coverage (O:Pt = 1:4) and 1/9 = 0.11 ML coverage (O:Pt = 1:9) respectively.

Calculation Details

All calculations were performed using the plane-wave Vienna Ab Initio Software Package (VASP) with the PBE exchange-correlation functional [1-4,7-8]. Core electrons were treated using the Projector Augmented Wave approach [5,6]. 1x1x1 Monkhorst-Pack mesh was used to sample k-space for the isolated O atom whereas 12x12x1 and 8x8x1 Monkhorst-Pack meshes were used to sample k-space for the 2×2 and 3×3 supercells, respectively. The plane wave cut-off energy was set to 550 eV and the structural optimizations considered complete when the magnitude of the forces on each atom was less than 0.02 eV. Dipole corrections were included in all surface calculations. Surface calculations used a 4-layer slab model wherein the bottom two layers were frozen during optimization. The lattice constants used was that determined using DFT instead of experiment; a = 2.78.

For discussions on convergence with respect to k-points and energy cut-off follow this link.

Results

Below are presented all energies calculated using VASP for the purposes of this exercise. First we present the energies of the bare surfaces as well as the isolated oxygen molecule followed by the calculated energies of the adsorbed oxygen at different binding sites.

SystemEnergy (eV/atom)
O2-9.864
(2x2) Surf-5.762
(3x3) Surf-5.762
Table 1. Energies of Oxygen and Bare Surfaces

Fig. 4 Adsorption energies of atomic Oxygen on Pt(111) at 0.25 and 0.11 ML.

From the above results, particularly Fig.4 , a few observations can be made (elaboration to these observations is given in the following section):

  1. At 0.25 ML coverage, the adsorption energies for O at the fcc and bridge sites are identical, and the lowest out of all sites (meaning O appears to preferentially bind to both the fcc and bridge sites at this coverage).
  2. At 0.11 ML coverage the adsorption ebergies for O at the fcc and bridge sites are identical, and the lowest out of all sites (meaning O appears to preferentially bind to both the fcc and bridge sites at this coverage).
  3. The difference in adsorption energies between 0.25 and 0.11 ML coverage is somewhat inconsistent: ignoring the bridge site calculations and comparing only hcp, fcc and atop sites, the adsorption energy is slightly lower for 0.25 ML in the case of  the fcc site while lower for 0.11 ML in the case of the hcp site and again lower for 0.11 ML in the case of the atop site.
  4. Overall there is little difference in the magnitude of the adsorption energy between coverages for the same site.

Conclusions

We now try to reason reason with our results/observations from above.

In regards to point 1, a simple look at the optimized geometries reveals that initially placed bridge oxygen “fell” into the more stable fcc site. If one is careful about the choice in calculation parameters (specifically the maximum ionic displacement), it is possible to recover the actual bridge site adsorption energy. We leave this discussion here as it is theoretically and experimentally predicted that O will not bind to bridge sites, though calculating the bridge site adsoption energy would make a nice exercise in understanding how different calculation parameters affect one’s results. We can conclude that at 0.25 ML O adsorbs at the fcc site.

Point 2, similar to point 1, simply reveals that the 0.11 ML bridge site calculation “fell” to the more stable fcc, reinforcing the idea that the bridge site equilibrium geometry is sensitive to the calculation parameters. Regardless, the bridge sites for both 0.25 and 0.11 ML coverage failed to converge to the desired geometry and instead relaxed to other adsorption sites. From this we may conclude that the bridge site is not the preferred binding site of atomic oxygen on Pt(111).

Below we show the geometry of the system as built as well as after convergence for the bridge site calculation at 0.11 ML to show what we mean be the Oxygn “falling” into the more stable fcc adsorption site.

Fig. 5 0.11 ML bridge site geometry as built (left) and after convergence (right).

Comparing the two figures we can see the “guessed” (initial) position of the oxygen is rather close to both the equilibrium fcc and hcp sites. Due to this, during optimization when the atoms move, it is possible the O explores a region in space that is “too close” to the minimum associated with the fcc site. Since VASP is searching for a minimum and not a specific minimum, this means once the O explores regions of space that fall in the fcc minimum, the calculation will continue to allow the O atom to relax into the fcc site.

Moving to point 2 we may concisely conclude that at 0.11 ML O adsorbs at the fcc site.

Our last two observations are a little more nuanced. In this calculation scheme, we have chosen not to apply zero-point energy corrections, nor have we included any entropic effects. In this case, we might expect out entropic effects to be roughly the same since both the 0.25 and 0.11 ML cases have 1 O atom and the same number of metal atoms “before” and after “adsorption”. Zero-point energy corrections (ZPE) can be significant, at least relative the the energies we are considering.

Thus, for now, we can conclude that O binds to the fcc site of Pt(111) surfaces at 0.25 and 0.11 ML coverage and that without ZPE and entropy corrections, there is a negligible difference in adsorption energies with respect to the coverage.

While the effect of coverage is not clear using the methods outlines above, it is reassuring that our calculations predict O to preferentially bind to the fcc site at both 0.25 and 0.11 ML coverage, as is found in experiment and predicted by computation [9].

Future Work

Naturally one would like to see how the ZPE and entropy corrections influence the results. One would expect there to be some increase in the difference between adsorption energies at 0.25 and 0.11 ML coverage. On a similar note, in this work we have used an asymmetric slab model with 4 layers (as is common for efficiency). One may also consider a symmetric slab model or perhaps a 5 layer slab to see if there is any splitting between these two coverages. This will be explored in future posts.

References


[1]     G. Kresse and J. Hafner. Ab initio molecular dynamics for liquid metals. Phys. Rev. B,                      47:558, 1993.

[2]     G. Kresse and J. Hafner. Ab initio molecular-dynamics simulation of the liquid-metal-                      amorphous-semiconductor transition in germanium. Phys. Rev. B, 49:14251, 1994.

[3]     G. Kresse and J. Furthmüller. Efficiency of ab-initio total energy calculations for metals and            semiconductors using a plane-wave basis set. Comput. Mat. Sci., 6:15, 1996.

[4]     G. Kresse and J. Furthmüller. Efficient iterative schemes for ab initio total-energy                            calculations using a plane-wave basis set. Phys. Rev. B, 54:11169, 1996.

[5]     D. Vanderbilt. Soft self-consistent pseudopotentials in a generalized eigenvalue                              formalism. Phys. Rev. B, 41:7892, 1990.

[6]      G. Kresse and J. Hafner. Norm-conserving and ultrasoft pseudopotentials for first-row                   and transition-elements. J. Phys.: Condens. Matter, 6:8245, 1994.

[7]      J. P. Perdew, K. Burke, and M. Ernzerhof. Generalized gradient approximation made                      simple. Phys. Rev. Lett., 77:3865, 1996.

[8]     J. P. Perdew, K. Burke, and M. Ernzerhof. Erratum: Generalized gradient approximation                 made simple. Phys. Rev. Lett., 78:1396, 1997

[9]     Chen, M., Bates, S. P., Santen, van, R. A., & Friend, C. M. (1997). The chemical nature of                    atomic oxygen adsorbed on Rh(111) and Pt(111): a density functional study. Journal of                  Physical Chemistry B, 101(48), 10051-10057.


Determination of Pt crystal structure and corresponding lattice constant

In this project, the energetically favorable crystal structure of Pt and corresponding lattice constant were determined using Density Functional Theory. The total energies were computed in Material Studio with CASTEP Calculation Package [1]. The functional of Perdew Burke, and Ernzerhoff was employed [2]. A plane wave basis set was used with a cut-off energy of 321.1 eV and OTFG ultrasoft pseudopotentials was solved using Koelling-Harmon treatment. The pseudo atomic calculation was performed for Pt 4f14 5s2 5p6 5d9 6s1.

Determine Energy Cut-off
The energy cut-off was determined by considering both calculation accuracy and computational cost. Pt fcc with lattice constant of 3.21 angstrom was randomly selected to perform a series of calculation, in order to determine energy cut-off. As shown in Fig.1, the fluctuation of cohesive energy becomes smaller as energy cut-off increases, while the computational cost has an increasing trend. In order to guarantee the accuracy and stability of our data and also keep computational cost acceptable, we choose energy cut-off 321.1 eV.


Fig.1 a.cohesive energy for 12 energy cut-off values b. computational time for 12 energy cut-off values

Determine K Points
Similar to energy cut-off determination, determining the number of K points was also based on calculation accuracy and calculational expense. From Fig.2, it is clear that computational cost increase with number of K points and cohesive energy becomes more stable with the energy difference of 0.05 eV between 20 and 28 kpoints


Fig.2 a.cohesive energy for 6 K points values b.Computational time for 6 K points values

Determine Pt Crystal Structure and Lattice Constant
Simple cubic structure
For simple cubic structure, 10 × 10 × 10 K points were sampled with 0.1 eV Gaussian smearing width. The energetically most favorable lattice constant is 2.6 Å with cohesive energy of -9.175 eV.

Fig.3 Cohesive energies of Pt in simple cubic structure as a function of lattice parameters

Face center cubic structure
For face center cubic structure, 12 × 12 × 12 K points were sampled with 0.1 eV Gaussian smearing width. The energetically most favorable lattice constant is 3.924 Å with cohesive energy of -9.667 eV.

Fig.4 Cohesive energies of Pt in fcc structure as a function of lattice parameters

Hexagonal Close Packed (hcp) Structure
When performing calculations of Pt hcp, two parameters had to be considered. We randomly selected three lattice constants of a and 12 c values for corresponding a. 12 × 12 × 8 K points were sampled with 0.1 eV Gaussian smearing width. The energetically most favorable lattice constant is 2.7 Å and height of 5.4 Å with cohesive energy of -9.512 eV.

Fig.5 Cohesive energies of Pt in hcp structure as a function of lattice parameters

Conclusion
From calculations performed above, we can conclude fcc structure with lattice constant of 3.924 Å is energetically most favorable for Pt, which is in a good agreement with experiment 3.912 Å [3].

Reference
[1] “First principle methods using CASTEP” Zeitschrift fuer Kristallographie 220(5-6) pp. 567-570 (2005)
[2] Perdew, J. P; Burke, K; Ernzerhof, M. Phys. Rev. Lett. 1996, 77, 3865-3868
[3]”Precision Measurement of the Lattice Constants of Twelve Common Metals” Davey, Wheeler, Physical Review. 25 753-761 (1925)


Determination of Structure and Lattice Constant for Platinum

Overview of the Problem

This post will be about determining both the structure and lattice constant for platinum. This will be done using density functional theory (DFT) to calculate the cohesive energies across a range of lattice parameters for platinum in the simple cubic (SC), face-centered cubic (FCC), and hexagonal close-packed (HCP) structures.

In order to make sure the results are feasible, convergence tests are first done for both the number of k-points and the cutoff energies.

All calculations are done in Materials Studio with the CASTEP DFT package [1]. The functional used was that of Perdew Burke Ernzerhof [2], and the pseudopotential was obtained using the Koelling-Harmon solver for the 4f14 5s2 5p6 5d9 6s1 outer shells. 

Cutoff Energy Convergence

The cutoff energy was tested by starting at a cutoff energy of 360 eV and then increasing by increments of 30 eV to look for convergence in the free energy. For this test the lattice parameters of the three structures were chosen as a = 3.92 Å for FCC, a = 2.62 Å for SC, and a = 3.02 Å, c = 4.83 Å for HCP. These lattice constants were chosen for this test by roughly estimating the location of the minimum of the three structures at an energy cutoff of 300 eV. The results are outlined in table 1 and figure 1.


Energy Cutoff (eV)FCC Free Energy (eV)SC Free Energy (eV)HCP Free Energy (eV)
300-13050.818-13050.421-13049.923
330-13050.927-13050.534-13050.046
360-13050.960-13050.568-13050.080
390-13050.970-13050.578-13050.116
420-13050.973-13050.580-13050.119
450-13050.973-13050.581-13050.120
480-13050.974-13050.581-13050.120
510-13050.974-13050.581-13050.120
Table 1: Data for the energy cutoff convergence test.

As can be seen from the figure and the table, a lower energy cutoff here will overestimate the free energy. It can also be see that the variation in the free energy is less than 0.01 eV past the 390 eV cutoff energy. For consistency, a cutoff energy of 420 eV has been chosen for all calculations involving the determination of the lattice parameters.

K-Point Convergence

The k-point convergence was tested using an HCP structure with a = 3.12 Å and c/a = 1.6, an SC structure with a = 2.62 Å, and an FCC structure with a = 3.92 Å. The results are outlined in tables 2, 3, and 4, as well as figures 2, 3, and 4.

K-point GridNumber of K-pointsFree Energy (eV)
7x7x432-13050.000
8x8x5156-13049.970
9x9x675-13049.970
10x10x6240-13049.965
11x11x7144-13049.955
12x12x8456-13049.975
13x13x9196-13049.970
Table 2: K-point convergence data for HCP.
K-point GridNumber of K-pointsFree Energy (eV)
6x6x628-13050.960
8x8x820-13050.94
10x1010110-13050.943
11x11x1156-13050.945
12x12x12182-13050.945
13x13x1384-13050.943
14x14x14280-13050.943
15x15x15120-13050.945
16x16x16408-13050.945
Table 3: K-point convergence data for FCC.
K-point GridNumber of K-pointsFree Energy (eV)
10x10x1035-13050.460
11x11x1156-13050.470
12x12x1256-13050.490
13x13x1384-13050.500
14x14x1484-13050.510
15x15x15120-13050.500
16x16x16120-13050.500
Table 4: K-point convergence data for SC.

Figure 2: K-point convergence plot for SC

Figure 3: K-point convergence plot for HCP

Figure 4: K-point convergence plot for FCC


For the SC lattice, having few k-points gives energies that start above the convergence level with a tendency to decrease. This is not the case for the HCP lattice, where the energies start low and then increase before decreasing again. Lastly, for the FCC lattice we see that the energy starts above the convergence level before sharply decreasing and then approaching convergence.

Based on the results from the test of the k-point convergence, grids of 15x15x15 were chosen FCC and SC, while a grid of 13x13x9 was chosen for HCP.

Lattice Parameter for SC

The simple cubic structure is shown in figure 5.


Figure 5: Simple cubic lattice structure

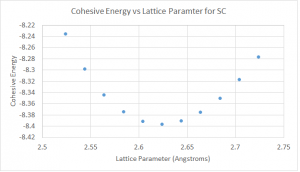
The calculations for the cohesive energy were done by first calculating the free energy per atom for the simple cubic structure, and then subtracting away the atomic energy of -13042.12 eV, which was obtained from the pseudopotential calculations. The results are shown in figure 6.


Figure 6: Cohesive energy vs lattice parameter for the simple cubic structure.

Pt in the simple cubic configuration is found to be stable with a lattice constant of a = 2.62 Å and a cohesive energy of -8.396 eV.

Lattice Parameter for FCC

The face-centered cubic structure is shown in figure 7.

Figure 7: The face-centered cubic lattice structure


The calculations of the cohesive energy were done in the same way as they were for the simple cubic lattice. The atomic energy will remain the same, so we simply calculate the free energy and take the difference. The results of these calculations are shown in figure 8.

Figure 8: Results from the calculation of cohesive energy for Pt in the FCC configuration for various lattice parameters

From the results of the calculation, it is found that Pt in the FCC configuration has a preferred lattice constant of about 3.96 Å, which gives a cohesive energy of -8.851 eV.

Lattice Parameter for HCP

The lattice of the hexagonal close-packed structure is shown in figure 9.


Figure 9: The hexagonal close-packed lattice structure

The HCP lattice has two lattice constants, so there is a much larger phase space to explore in order to locate the minimum cohesive energy. In order to sample this space, the ratio between the lattice constants, c/a, is held fixed at values of 1.57, 1.6, and 1.63. The parameters a and c are then varied in tandem to search for the preferred lattice constant. The results of these calculations are shown in figure 10.

Calculations for the cohesive energy of HCP Pt for c/a ratios of 1.57, 1.6, 1.63.

The results show that an HCP lattice of Pt is most stable with lattice constants of a = 2.98 Å and c = 4.77 Å for c/a = 1.6. These parameters give a cohesive energy of -7.996 eV.

Conclusions

The calculations done above give cohesive energies of -8.396 eV for SC,  -8.851 eV for FCC, and -7.996 for HCP. This implies that Pt is most stable in the FCC configuration with a lattice constant of 3.96 Å. Davey finds through experimental methods that Pt is most stable in the FCC configuration with a lattice constant of 3.91Å [3]. Using density functional theory, we have shown that we can correctly predicted that Pt naturally forms an FCC lattice. However, we have overestimated the lattice constant by about 0.05 Å.


References

[1] First principle methods using CASTEP Zeitschrift fuer Kristallographie 220(5-6) pp. 567-570 (2005).

[2] Perdew, J.P., K. Burke, and M. Ernzerhof, Generalized gradient approximation made simple.Physical review letters, 1996. 77(18): p. 3865.

[3] Davey, W. P. (1925). Precision Measurements of the Lattice Constants of Twelve Common Metals. Physical Review, 25(6), 753-761. doi:10.1103/physrev.25.753.

Determination of Lattice Constant of Platinum Cell

Introduction

Platinum is a chemical element with symbol Pt and atmomic number 78. The electron configuration is [Xe] 4f145d96s1. Its crystal structure is face-centered cubic (fcc, see Fig. 1), and the lattice constant is 3.9239 Å[1].

The target for this computation experiment is to use density functional theory (DFT) to evaluate the energy of fcc lattice at different lattice constants. The estimation of the lattice constant is hence decided by minimizing the energy. The result is compared with the standard data based on experimental measurements.

Key Factors of Density Functional Theory (DFT)

Denstity functional theory (DFT) is a computational method based on calculating the energy of a condensed matter system as a functional of the electron density. Thereare a lot of references that give systematic introductions and discussions on the method, which we will not go into details in this report[2]. The key factors affecting the calculation in this report include (1) Energy cut-off and (2) k-point sampling number. Energy cut-off refers the maximum energy of the bands involved in our calculation. The number of the bands included for a typical calculation is about 20, and this number may increase when higher energy resolution is required. K-point sampling number refers the number of sampling points within the first Brillouin zone. Usually the higher the energy cut-off is and the larger the sampling number is, the better the accuracy is. Due to limitation on the computational resources, we have to decide lowest values of both the factors that could meet requirements.

We performed several trial calculations and compared their numerical variance to decide the appropriate values. (1) We fix the cut-off energy at 800 eV, which is high enough for a simple calculation, and explore the effect of k-point density on energy calculation and atomic energy to figure out the minimum sufficient value for k-point sampling number. (2) We use the number of k-point sampling mentioned above and explore the effect of cut-off energy and decide the best cut-off energy that balances the calculating speed and precision. Both tests are performed at conventional lattice constant a=4Å.

Energy Evaluation and Lattice

Applying the parameters decided above, several calculations of free energy at lattice constant ranging from 3.4 ~ 4.4Å were performed. Then a quadratic fitting was performed to minimizing energy. The corresponding lattice constant is our theoretical prediction of the true lattice, and it is compared with standard value. A more detailed discussion can be found in the experimental section in this report.

Experimental Facts

The basic parameters and key factors shared in all the calculations are listed below:

Lattice cell type: primitive cell of face centered cubic (fcc)

Functional Type: GGA PBE

Smearing width: 0.10

Pseudo Potential Orbitals: 4f14 5s2 5p6 5d9 6s1

Pseudo Type: OTFG ultrasoft

k-points origin shift: no

K-point Number Examination

Based on the discussion above, we calculated the free energy of the lattice at a=4Å. The results are shown in Fig. 2. Based on this result, it is sufficient to choose 16×16×16 as the appropriate sampling number for one wants acceptable precision without spending too much time.

Energy Cut-off Examination

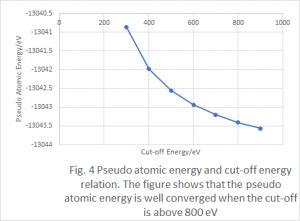
The convergence of energy and pseudo atomic energy are displayed as follows. The difference between them is the binding energy per atom. Although it is not fully converged, the pseudo atomic energy variance is highly suppressed when the cut-off energy is higher than 800eV, which indicates that 800eV is a reasonable choice for our estimation of the binding energy (Fig.3 and Fig.4).


 Energy at Different Lattice Constants

To best fit the plots in the graph, a polynomial to the order of 3 was applied, and the minimum free energy was reached at lattice constant a=3.95Å. Compared to the standard result, this calculation has an error of 0.6%.

Reference

[1] https://en.wikipedia.org/wiki/Platinum

[2]Sholl, David, and Janice A. Steckel. Density functional theory: a practical introduction. John Wiley & Sons, 2011.

Determination of the crystal structure with optimal lattice constant for Pt

  1. Description of the problem

For this first project, we aim to predict the most-favored crystal structure of Pt and calculate the optimal lattice parameters for these structures.

Usually, the metal crystals can have simple cubic (sc), face centered cubic (fcc), and hexagonal close packed (hcp) structures. In this work, we will firstly examine the optimal lattice parameter for sc Pt based on the energy of bulk Pt, followed by the tests of on the fcc structure. Both optimal lattice parameter a and the ratio a/c will be determined for hcp Pt. Convergence tests will be done with respect to the number of k-points and the cutoff energy for all studies.

The Vienna Ab initio Simulation Package (VASP) is used to perform the periodic DFT calculations,1-3 employing the projected augmented-wave (PAW) pseudopotentials,4,5 as well as generalized gradient approximation with the exchange-correlation functional by Perdew, Burke, and Ernzerhof (PBE).6

  1. Simple cubic

The sc structure of Pt is built using the software Material Studio as shown in Figure 1. In each unit cell, there is one Pt atom.

               Figure 1. Unit cell of sc Pt                       Table 1. Results of k-points convergence for sc

Before we can calculate the energy of this whole system, the convergence tests are required with respect to the number of k-points and the cutoff energy. The criteria for choosing the number of k-points and energy cutoff in the following calculation is set to have the energy difference within 0.01 eV.

Firstly, in order to test the convergence of the number of k-points, we initially set the cutoff energy to 400 eV. The results of using number of k-points ranging from 1 to 120 are summarized above in Table 1. Figure 2 shows the trend of bulk energy as well as the computational cost versus the number of k-points.

Figure 2. Bulk energy and computational cost versus the number of k-points for sc

We can see the bulk energy becomes more stable with increased number of k-points while the computational cost keeps increasing. Considering the balance between higher accuracy and cost, the k-points sampling of 14x14x14 is chosen for further calculations.

The convergence of the cutoff energy is also tested as summarized in Table 2 with fixed k-points sampling shown above. An interesting thing is that we can see the (pseudo) atomic energy keeps becoming lower while the cutoff energy is increased (later we will see the same behavior for all other structures). Figure 3 shows the relationship of bulk energy and computational costs depending on the cutoff energy.

Table 2. Results of the cutoff energy convergence for sc

Figure 3. Bulk energy and computational cost versus the cutoff energy for sc

Similar as the cases for k-points sampling, the energy becomes stable with increased cutoff energy while the cost keeps increasing. The energy cutoff of 400 eV is chosen for further calculations.

In order to determine the optimal lattice parameter, we vary the lattice parameter to find the one resulting in lowest bulk energy. We firstly do a rough search using step size of 0.1 Å from 1.50 to 3.00 Å. With such rough search, we are able to determine the interval where the optimal value lies in and based on that, we can do a more precious search with step size of 0.01 Å. All the results are shown in Figure 4.

(a)                                                                            (b)

Figure 4. Bulk energy versus the lattice parameter for sc. (a) for rough search and (b) for detailed search.

From the first plot in Figure 4, we can see that the optimal value is in the interval from 2.50 to 2.70 Å. The detailed search is done in this interval with step size of 0.01Å. Finally, the optimal lattice parameter is determined to be 2.62 Å, which gives the lowest bulk energy of -5.655 eV for the simple cubic structure.

  1. Face centered cubic

The search for the optimal lattice parameter of fcc Pt is very similar to the study of sc Pt. The unit cell of fcc Pt is built with Material Studio as shown in Figure 5, containing on Pt atom.

               Figure 5. Unit cell of fcc Pt                    Table 3. Results of k-points convergence for fcc

As we did before, the convergence tests are firstly made and the results on k-points are summarized in Table 2. Figure 6 shows the relationship of bulk energy as well computational time to the number of k-points. Similarly, the k-points sampling of 12x12x12 is finally used.

Figure 6. Bulk energy and computational cost versus the number of k-points for fcc

The same tests on cutoff energy is done as summarized in Table 4 and Figure 7. The cutoff energy we use for further calculations of fcc Pt remains 400 eV.

Table 4. Results of the cutoff energy convergence for fcc

Figure 7. Bulk energy and computational cost versus the cutoff energy for fcc

The search for the optimal lattice parameter is carried out in a similar way, but roughly ranging from 3.10 to 4.30 Å. The results are shown in Figure 8. We can see from the left side of Figure 8 that the optimal lattice parameter lies in the interval from 3.90 to 4.10 Å. Thus, the optimal lattice parameter is determined with the detailed search using step size of 0.01Å. The optimal lattice parameter is 3.97 Å, which gives the lowest bulk energy of -6.097 eV for the face centered cubic structure.

(a)                                                                            (b)

Figure 8. Bulk energy versus the lattice parameter for fcc. (a) for rough search and (b) for detailed search.

  1. Hexagonal close packed

The difference in determining the optimal lattice parameter for hcp Pt is that there will be different optimums for different c/a. So in this section, we will compare the opmital lattice parameter for several potential c/a ratios (in this section, cases of c/a=1.57, 1.60, 1.63, 1.67, 1.70, 1.73 will be studied) and find the most-favored one which gives us the lowest bulk energy among them. Similarly, the hcp unit cell is consturcted using Material Studio as shown in Figure 9 containing 2 Pt atoms.

Figure 9. Unit cell of hcp Pt

The case of c/a=1.60 is chosen to test the convergence. The results are summarized below in Table 5. Figure 10 and 11 show the trends of bulk energy as well as computational cost with respect to the number of k-points and cutoff energy, respectively.

Table 5. Results of the convergence tests for hcp

Figure 10. Bulk energy and computational cost versus the number of k-points for hcp

Figure 11. Bulk energy and computational cost versus the cutoff energy for hcp

Accordingly, the k-points sampling is chosen to be 10x10x6 and the cutoff energy is 400 eV.

The search for optimal lattice parameter is achieved using the same method, but with different c/a values roughly ranging from 2.00 to 3.30 Å. Figure 12 shows the results of rough search for different c/a values.

Figure 12. Bulk energy versus the lattice parameter for hcp (rough search)

We can see that, for the case of c/a=1.56, the optimum lies in the interval from 2.80 to 3.00 Å. For all other cases, the optimal parameter is in the interval from 2.70 to 2.90 Å. The results for corresponding detailed search is shown in Figure 13 below. The final results reveal that the optimal lattice parameter for hcp Pt is 2.76 Å with c/a=1.73, giving the lowest bulk energy of -6.046 eV.

Figure 13. Bulk energy versus the lattice parameter for hcp (detailed search)

  1. Conclusion

According to the results above, we know that the optimal lattice parameters for these three different structures are 2.62, 3.97, and 2.72 Å, respectively. Among them, the fcc structure with lattice parameter of 3.97 Å gives the lowest bulk energy of -6.097 eV (-5.655 and -6.046 eV for sc and hcp). The experimental lattice constant is 3.92 Å. Our result is about 1.01% larger than the experimental observation value, which is commonly seen while using PBE functional as PBE tends to overestimate the lattice constant.

Reference

  1. Kresse, G. and J. Hafner, Ab initio molecular dynamics for liquid metals. Physical Review B, 1993. 47(1): p. 558.
  2. Kresse, G. and J. Hafner, Ab initio molecular-dynamics simulation of the liquid-metal–amorphous-semiconductor transition in germanium. Physical Review B, 1994. 49(20): p. 14251.
  3. Kresse, G. and J. Furthmüller, Efficient iterative schemes for ab initio total-energy calculations using a plane-wave basis set. Physical review B, 1996. 54(16): p. 11169.
  4. Kresse, G. and D. Joubert, From ultrasoft pseudopotentials to the projector augmented-wave method. Physical Review B, 1999. 59(3): p. 1758.
  5. Blöchl, P.E., Projector augmented-wave method. Physical review B, 1994. 50(24): p. 17953.
  6. Perdew, J.P., K. Burke, and M. Ernzerhof, Generalized gradient approximation made simple. Physical review letters, 1996. 77(18): p. 3865.

Determining the Structure and Lattice Constant of Platinum

In this project,  the lattice constant and structure of crystalline platinum were found by performing CASTEP energy calculations and finding where the energy was minimized [1]. These calculations were performed in Materials Studio using the GGA Perdew Burke Ernzerhof (PBA) functional. The calculations used an energy cutoff of 321.1eV for the rougher calculations and 420eV for the finer calculations. The pseudopotential was solved using the Koelling-Harmon atomic solver with the interior shells 1s2 2s2 2p6 3s2 3p6 3d10 4s2 4p6 4d10, giving an energy of -13041.2296 eV. The outer shells used in the calculations consisted of the 4f14 5s2 5p6 5d9 6s1 electrons.

1. Simple Cubic Lattice (P23 Point Group)

Fig. 1. A primitive cell of the simple cubic lattice

For the simple cubic lattice rough calculations, 6x6x6 k points were sampled with 0.1eV Gaussian smearing and no shift. After applying symmetry, this sampling reduced to 11 total k points.

Table 1. The roughly calculated energy of the simple cubic lattice for varying values of the lattice constant.

Fig. 2. The roughly calculated energy of the simple cubic lattice configuration for different lattice constants. The minimum occurs at 2.6 Angstroms, which will help determine a starting value for both the finer, more time consuming simple cubic calculations and the rough calculations for other lattice structures. The lines connecting the data points act as a guide to the eye and are not data.

Fig. 3. K space sampling vs. energy (eV) for the P23 simple cubic lattice. The energy converges to 0.01eV beyond 176 points.

Upon finding the approximate lattice constant with an 11 point k space sampling and a 321.1eV energy cutoff, we can perform the same calculations around that point with a higher k space sampling and cutoff energy to find a more accurate result. For these calculations, 176 k points were sampled (16x16x16) and a cutoff of 420eV was used. These results should converge to 0.01eV. Ultimately, these calculations resulted in a lattice constant of approximately 2.62 Angstroms.

Table 2. The finer lattice constant vs. energy calculations.

Fig 4. Finer lattice constant vs. energy graph. The lines connecting the data points act as a guide to the eye and are not data.


2. Hexagonal Close-Packed Lattice (D3H-3 Point Group)

Fig. 5. A primitive cell of the hexagonal close-packed lattice.

For the hexagonal close-packed lattice, 24x24x18 k points were sampled with 0.1eV Gaussian smearing and a shift of (0.021inverse Angstroms ,0.021 inverse Angstroms,0). The calculation was ultimately performed using 882 k points. For this lattice structure, only calculations with a 420eV cutoff were performed resulting in approximately a 2.60 Angstrom lattice constant. For these calculations, the ratio c/a was set at 1.633 because it gives ideal hard sphere close packing.

Table 3. Table of the HCP lattice constant (angstroms) and corresponding energy. The minimum lies at approximately 2.60 and 2.61 Angstroms.

Fig. 6. Graph of the Pt HCP lattice constant (Angstroms) vs. energy (eV). The lines connecting the data points act as a guide to the eye and are not data.

Fig. 7. K space sampling vs. energy (eV) for the HCP lattice. The energy converges to 0.01eV beyond 882 points.

3. Face Centered Cubic Lattice

Fig. 8. A conventional cell of the FCC cubic lattice.

3a. F23 Point Group

For the first F23 FCC lattice calculations, 8x8x8 k points were sampled with 0.1eV Gaussian smearing and no shift. This resulted in the rough calculation being performed on 88 total k points and the finer calculations being performed on 176 k points. The finer calculation were performed on 16x16x16 k points, resulting in a total sample of 688 points, with an energy cutoff of 420eV. Both the rough and fine calculations resulted in a lattice constant of 2.80 Angstroms.

Table 4. Shows the roughly calculated energy of the F23 FCC lattice compared to the lattice constant.

Fig. 9. Shows a rough calculation of the energy of the F23 FCC lattice vs. the lattice constant. The minimum occurs around 2.8 Angstroms, which will be used as a starting point for the finer calculations. The lines connecting the data points act as a guide to the eye and are not data.

Fig. 10. K space sampling vs. energy (eV) for the F23 FCC lattice. The energy converges to 0.01eV beyond 76 points.

Table 5. Shows the lattice constant (Angstroms) vs. energy for the F23 FCC lattice with a finer k space sampling and energy cutoff. The minimum lies at approximately 2.8 Angstroms.

Fig. 11. Graph of the lattice constant (Angstroms) vs. the finely calculated energy (eV) of the configuration. The lines connecting the data points act as a guide to the eye and are not data.

3b. FM-3M Point Group

For the second FCC lattice calculation, the FM-3M point group was used, as platinum has been shown to form an FCC lattice under this point group in nature [2]. For the rough calculation, 8x8x8 k points were sampled with a 0.1eV Gaussian smearing and no shift, for a total of 20 k points. For the finer calculations, 16x16x16 k points were sampled, for a total of 120 points.

Table 6. Shows the energy of the FM-3M FCC lattice compared to the lattice constant.

Fig. 12. Shows the lattice constant vs. the energy of the FM-3M FCC Lattice for a rough calculation. The minimum occurs at 3.95 Angstroms, which will be used as a starting point for finer calculations.The lines connecting the data points act as a guide to the eye and are not data.

Fig. 13. K space sampling vs. energy (eV) for the F23 FCC lattice. The energy converges to 0.01eV beyond 35 points.

Table 7. Results for the fine calculations of the energy of the FM-3M FCC lattice at various lattice constants.

Fig. 14. Graph of the fine calculations of the lattice constant (Angstroms) vs. energy (eV) for the FM-3M FCC Lattice. The lines connecting the data points act as a guide to the eye and are not data.

For the FM-3M FCC lattice, the fine calculations were performed with a 420eV energy cutoff and a k space sampling of 16x16x16, resulting in a total of 120 k points being used. These results gave a minimum energy of -52203.84eV at 3.96 Angstroms.

Final Results

(a)

(b)

Fig. 15. (a) Comparing the rough results from the F23 FCC lattice, the P23 simple cubic lattice, and the D3H-3 HCP lattice with c/a=1.633, the F23 lattice has the lowest energy minimum. (b) Comparing all four lattice structures, the FM-3M FCC lattice energy is approximately 4 times lower and reaches a minimum at about 1.16 Angstroms higher lattice constant. The lines connecting the data points act as a guide to the eye and are not data.

For the first three lattice configurations, the F23 FCC lattice had the lowest energy minimum at lattice constant 2.8 Angstroms. However, the FM-3M FCC lattice has a lower energy by approximately a factor of 4, with a minimum at 3.96 Angstroms. This lattice configuration closely matches with experimental data, which shows that platinum forms a lattice in the FM-3M point group with lattice constant 3.92 Angstroms [2].

Appendix: Energy Cutoff Convergence

For the finer energy vs. lattice constant calculations, a 420eV cutoff energy was chosen based on the energy’s convergence to 0.01eV beyond this point.

Fig. 16. Graph of the energy cutoff (eV) vs. energy (eV) for platinum in an F23 FCC lattice. The energy converges beyond a cutoff of approximately 390eV and 420eV was ultimately used for the finer energy calculations.

Bibliography

2. Povarennych, A. & Povarennyck, A. Crystal chemical classification of minerals. 192 (Plenum Press, 1972).