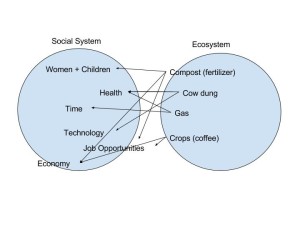
In my diagram, the object has an impact on the object that the arrow is pointing towards. For example, the fertilizer made by the biogas impacted women by providing job opportunities and doubling their income. It also impacted the economy because it was being sold. The landscape of this town included both the social system and the ecosystem of the town. The social system side of my system diagram includes women and children, health, time, technology, job opportunities, and the economy. The ecosystem includes compost (fertilizer), cow dung which powered the biogas, gas produced from the biogas, and new crops, like coffee plants. All of these social systems and ecosystems were inseparably part of the landscape. This also explains the human ecology of this town. For example, women and children were impacted highly by the income of the fertilizer produced by the biogas. The video took place in the technology capital of India, where new job opportunities pulled people from rural areas.
My system diagram is similar to the system diagram in the Marten reading because of the major technology component that the social system had. Without the new technology and the invention of the biogas, women in India would have to keep using firewood, causing health problems and an increase in time use. Compared to the Marten diagram, my social system did not show a huge impact on the population in India. The Marten diagram also connects the human activities and the ecosystem services. This includes the energy, material, and information. There was a need for the biogas mainly for convenience, not because it was hurting the population. There are similarities and differences because of what is being compared. My diagram is from biogas in India, but the location, beliefs, objects, and more can determine what is in the diagram and how they are compared. By comparing the two diagrams, we can see what truly impacts the social systems and the ecosystems. My location does not have a lot of the objects that the Marten diagram does. By comparing them, I learn about the many ways they impact each other.


Hi Sarah, this is Shoheb. I’d like to say the thing I liked most in your diagram was how you distinguished between the two systems. There was no confusion about whats happening even at first glance. The directional arrows were also a great touch as it specified exactly what is happening. I also like the fact you were able to cross over between elements from the two systems to show the relationship. Great work, and good luck rest of the semester!
Here’s the link to my diagram, thanks.
http://geog030.dutton.psu.edu/2016/01/27/biogas-in-india-5/
Hi Sarah, my name is Annaliese. Here is the link to my blog post: http://geog030.dutton.psu.edu/2016/01/28/annaliese-long-module-2/
Our diagrams are sort of the same because we include some of the same information. But I really like how you set up your diagram using two general circles with the information intertwining between each. I think it is interesting that you made each circle its own aspect, social and ecosystem. I also liked how you used the broad topics that were discussed in the video.