In today’s society, visual representation of information is highly valued. Images present a significant amount of information in a faster time. We created information literacy digital badge infographics to visually convey the cognitive processes embedded in the badge steps. This page shows these infographics.
Bloom’s Taxonomy
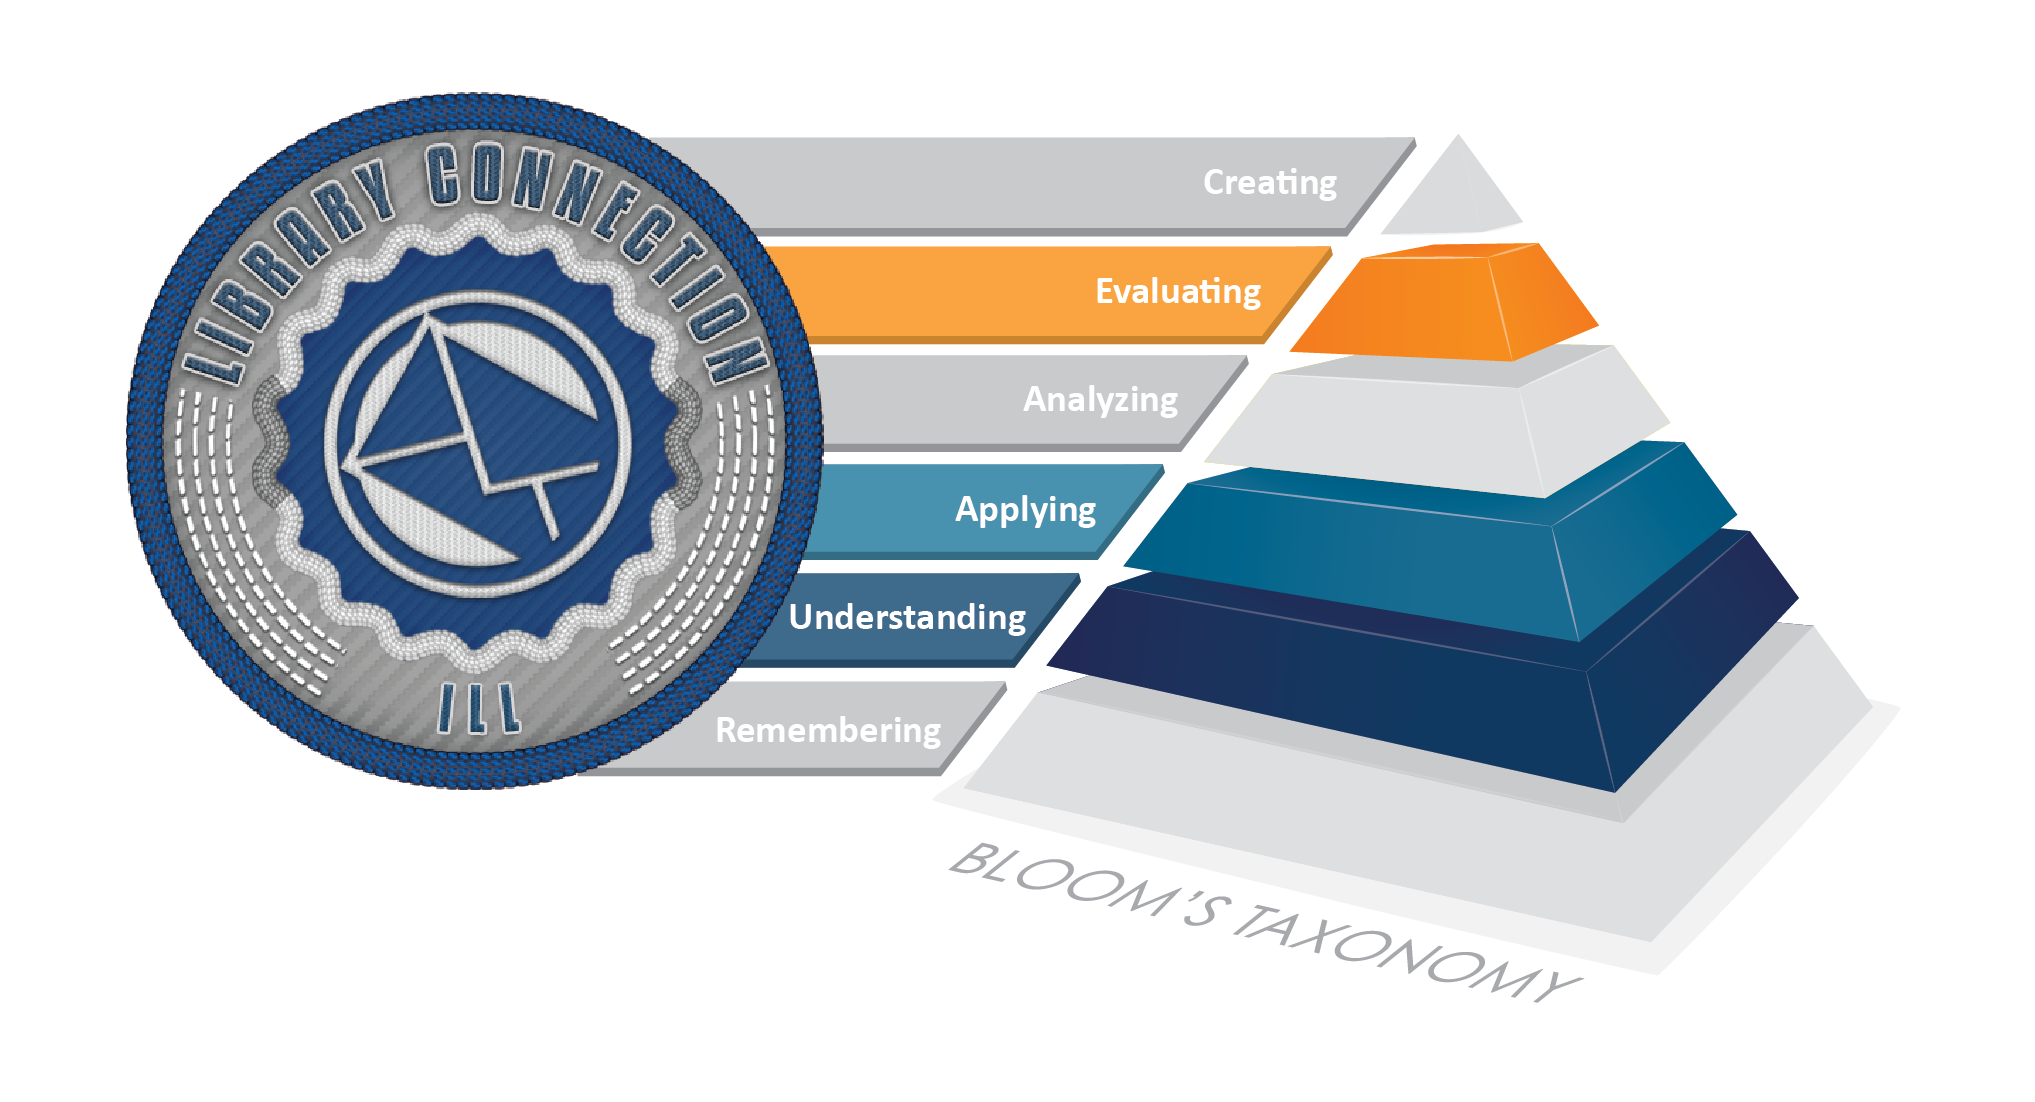
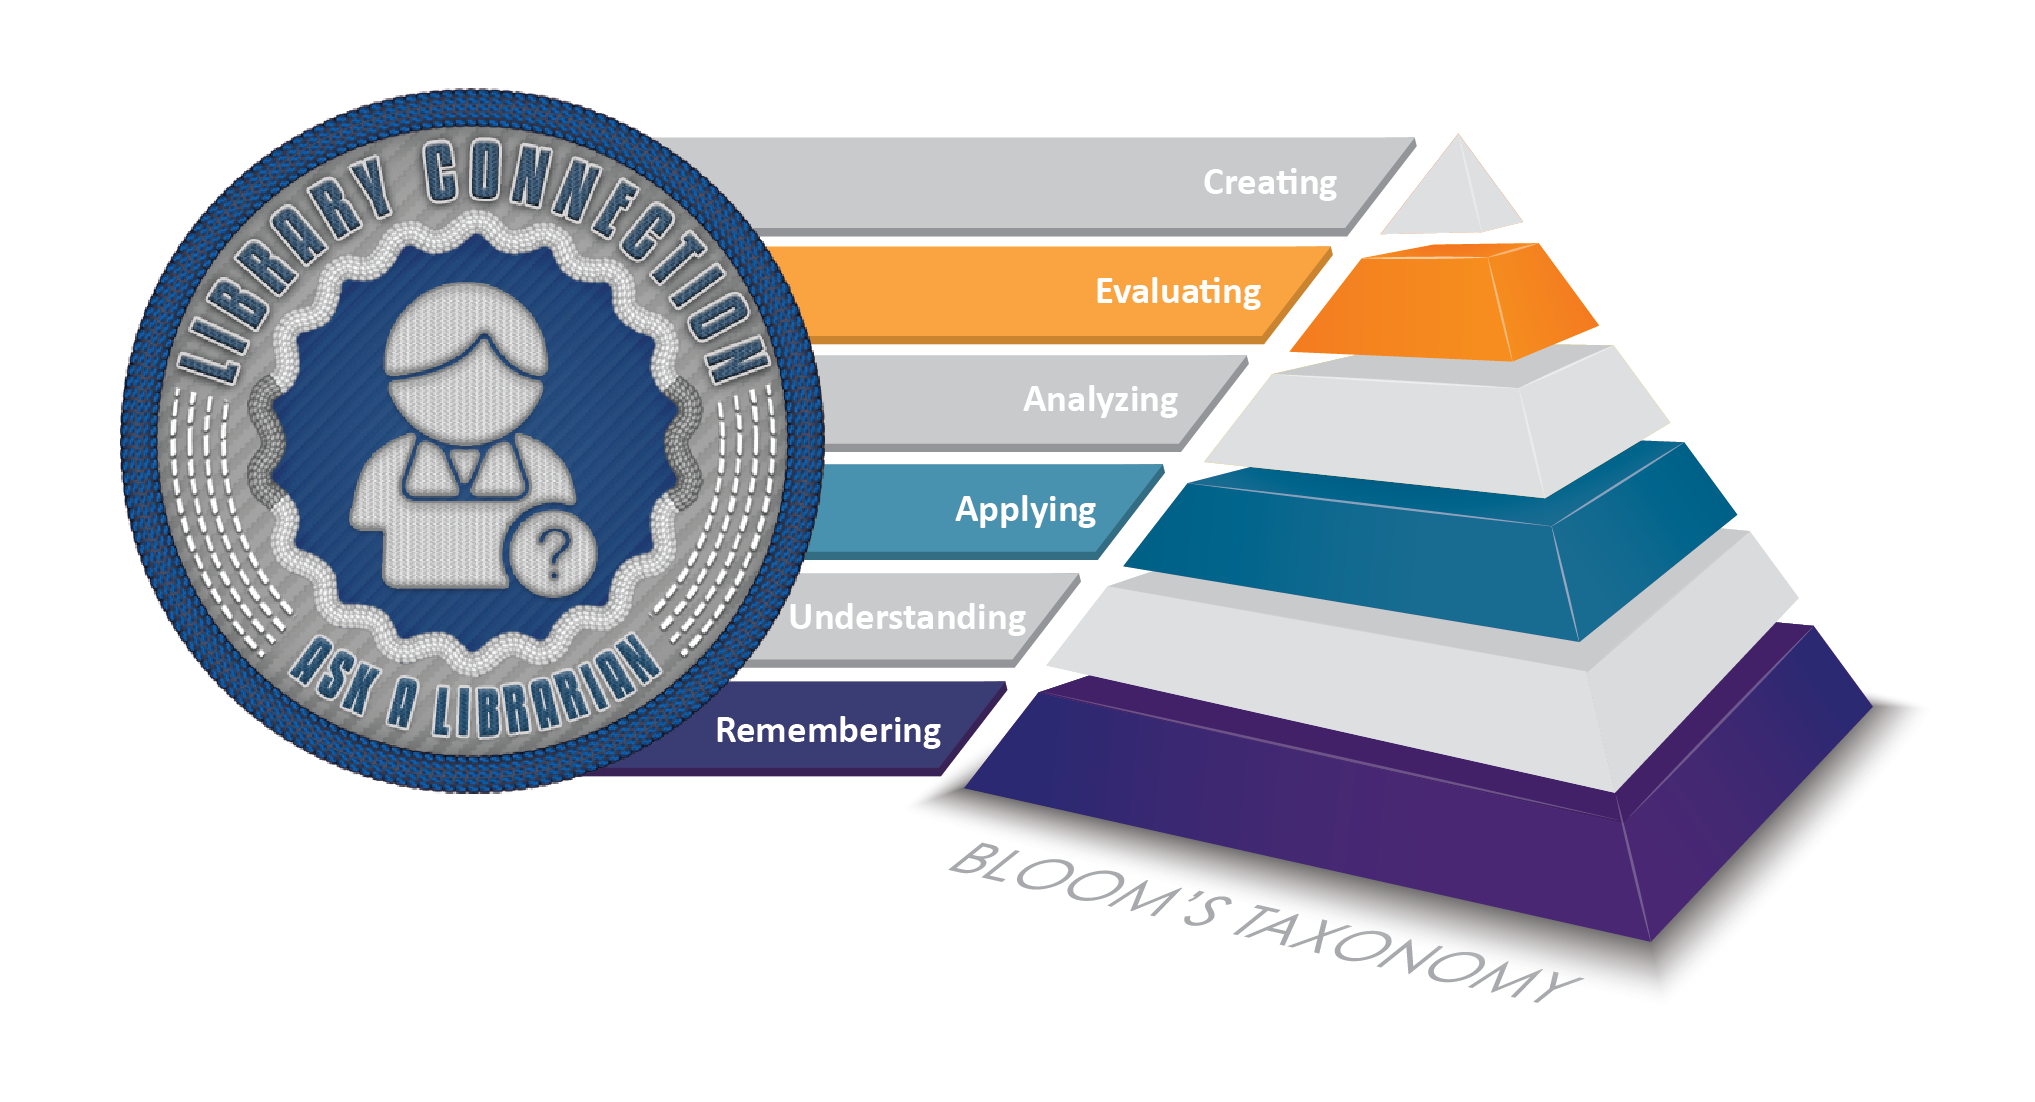
Bloom’s Taxonomy is frequently used to characterize the cognitive processes that students may use when learning. These levels represent differing abilities and application of skills. The intention of using these for the information literacy digital badges is twofold. First, we wanted to present the information literacy digital badges in a more ‘universal’ language so people interested in the badges could understand the types of cognitive processes students use when completing our badges. Second, we wanted to visually represent the processes students are using to the students so they can reflect on if they are obtaining these skills.
Infographics
Our infographics were created by Hannah Williams, a multimedia specialist at Penn State.
Organizer of Information
Citations

Organizing Projects
Organizing Information

Questioner of Information
Ethics

Evaluating Credibility

Primary vs. Secondary Sources

Popular vs. Scholarly Sources

Savvy Searcher
Keywords
Refining your Research

Recognizing Bias

Library Connection: Academic Integrity

Library Connection: Ask-A-Librarian
Library Connection: Library In Canvas

Library Connection: LionSearch

Library Connection: Requesting Materials