
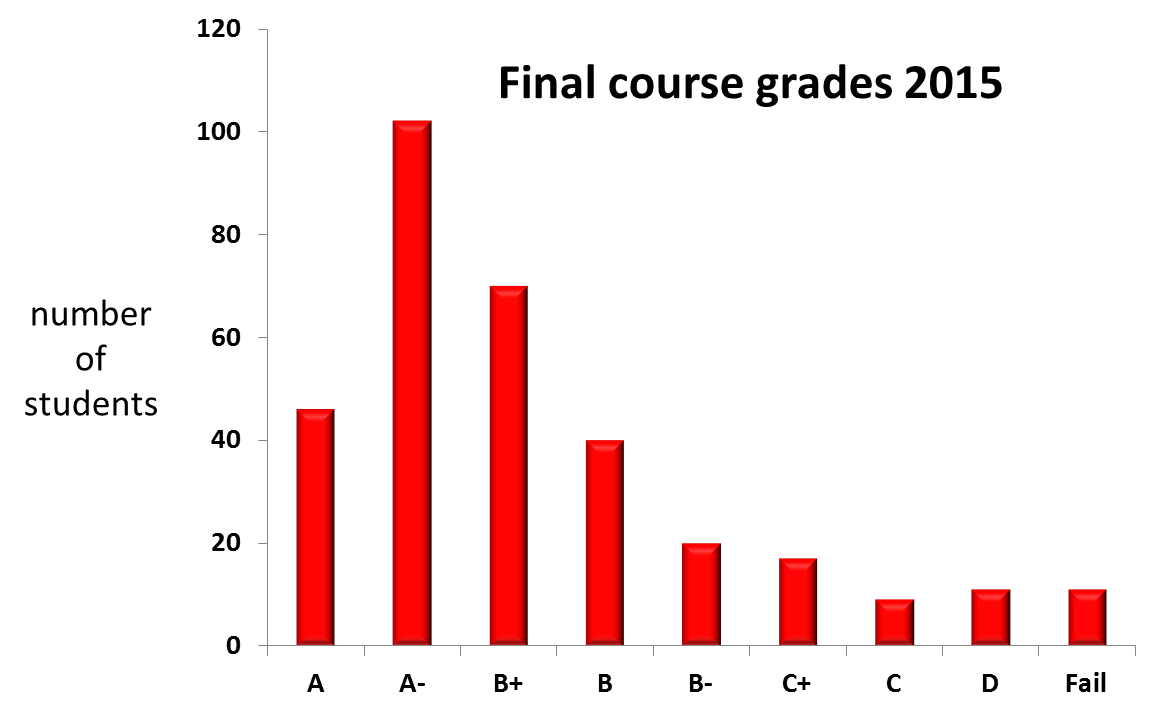
 The class average: 87% (B+). Of the 352 students we started with, 326 made it to the end. At least half the losses were from people trying to maintain their GPAs. Among the finishers, 45% of the finishers got some kind of an A, 67% got a B+ or better, and 79% got a B or better. One student scored over 100% through extra credit. Compared to last year, more A’s but also more students on a B- or less, the net effect being an almost identical average, as with 2013.
I say it every year, but there is simply no way to know what to make of this grade distribution. Am I setting the bar too high, too low, or just about right? It is one of the mysteries of higher education. I have heard it said in some places that an ideal grade distribution is about 20% getting some sort of A. Where does that figure come from? And why should students be competing against each other, rather than an absolute level of achievement?