
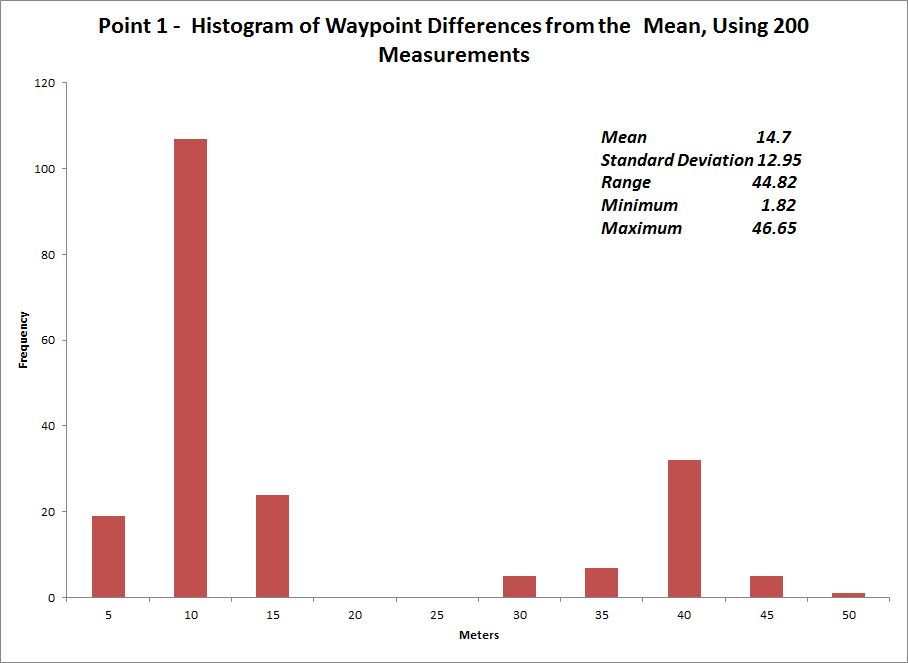
During the GPS testing lab each team recorded the UTM coordinates 25 times at each of five points.We finished with 200 measurements for each of the test points. We combined all the measurements for each of the points and calculated descriptive statistics.
The difference of each point from the average coordinate was calculated using the Pythagorean theorem. Histograms of the differences show a big difference in the results. In point 1 there was a great deal of difference among the results of each team. The combined data shows the wide variation. It would probably be a good idea to remeasure this point. Since the teams all used the same model of GPS receiver and measured during the same time period, these results point to a likely user error.
 For point 5 the differences are much smaller overall. They are also much more concentrated, indicating that all the readings were concentrated around the average, a consistent fix on the coordinates.
 Note that these charts used all the data points.