It is important to have visuals in the report because it can demonstrate and convey a idea more clearly and simply. Not just what the graphics within the report are important but how we present it is also important: labels, numbers, and titles for the graphics, the placement, the explanation of the graphic, citation of the graphics, and the aesthetic. In addition, the visual itself is important to, which graphics you decided to use: tables or graphs. For graphs, there are so many format, which is the best? There are many things to learn about putting visuals in the report.
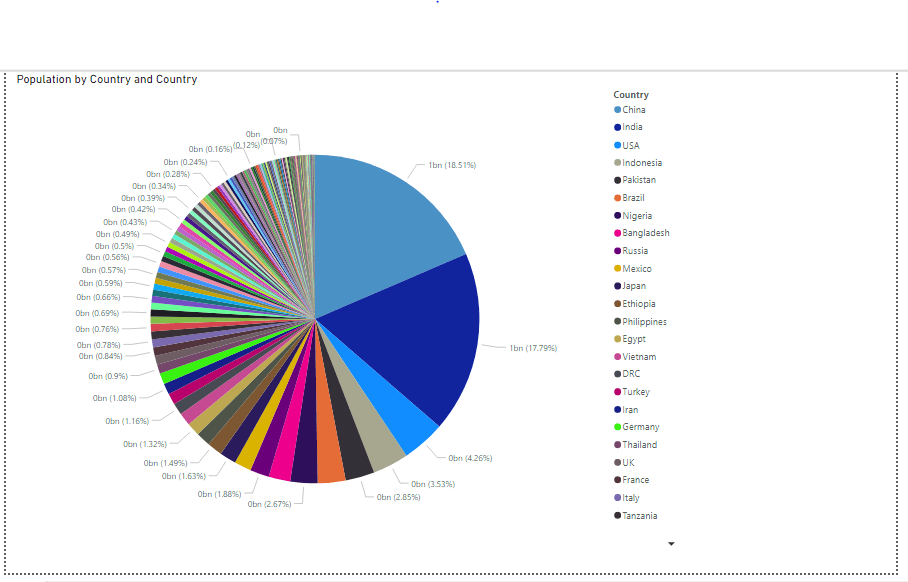
The right visuals for the report is important to convey the ideas. There are many tools that you can use in terms of graphics: tables, charts, graphs, illustrations, each serves a different purposes. The tables are usually used to showcase the detailed data in categories. The graphs like bar graph, line graph, and bubble chart are usually use for compare and contrast two or more subjects at the same point in time or compare change over time. The charts like pie chart, flow chart, and Gantt chart are use to show the relation of parts to a whole. Photos, animations, and film clips- illustrations- are use for showing the realistic detail. There are many more types of data visualization that we can choose, the ones mentioned is just the tip of the iceberg.