Page Content
A common type of technical diagram is a flowchart, concept map showing relationships between different concepts. In many cases, the long description could be a list-based outline describing different parts of the process.
See examples below.
Concept Map
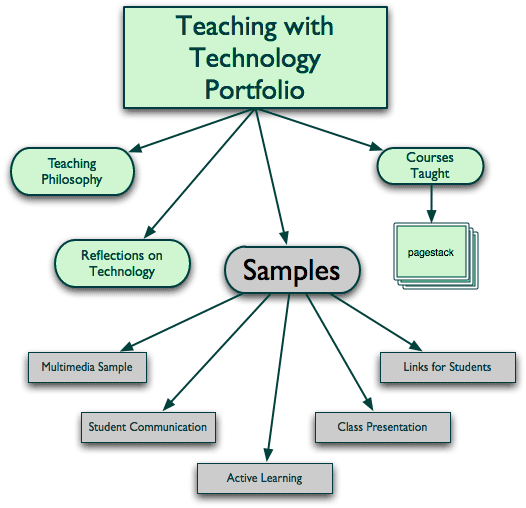
The following image is a concept map showing one way to organize pages of an online teaching portfolio. Below that is a text based outline which replicates the architecture within the image.
Concept Map Image

ALT ="Concept map diagram – See outline after image"
Outline of Concept Map
- Teaching Philosophy
- Courses Taught (can include course descriptions and syllabi)
- Teaching Awards and Publications
- Teaching with Technology Samples
- Teaching Philosophy in relation to technology
- Links to discipline or course-related links.
- List of technologies used
- Samples
- Course in which it was used
- Teaching goal of the sample
- Screen captures or actual document (graphics, audio, video, Powerpoint)
- Reflections on how technologies worked
Flowchart
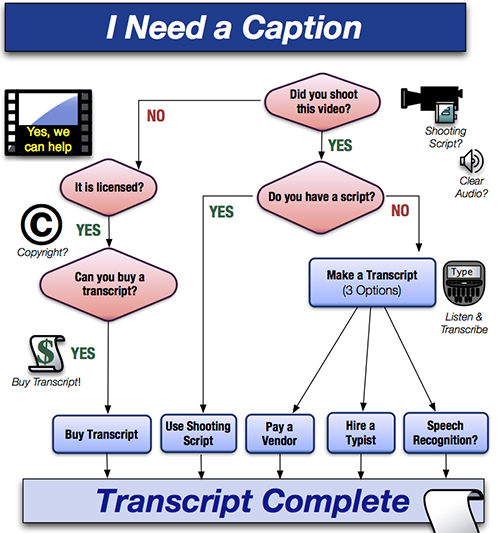
A flow chart, process or cycle can also be described in terms of an outline, so long as the outline indicates the progression of steps either forwards, backwards or looping. See the example below of describing a flowcart of a captioning workflow.
Caption Worflow Image

ALT="Flow Chart image I Need a Caption – see outline after image"
Outline Description
Title: "I Need a Caption"
Top of chart begins Q: "Did you shoot this video?"
- If "No" to shooting video, then Q: "Is it licensed?"
- If "Yes", then Q: "Can you buy a transcript?"
- If "Yes", then "Buy Transcript," then "Transcript Complete"
- If "Yes", then Q: "Can you buy a transcript?"
- If "Yes to shooting video, then Q: "Do you have a script?"
- If "Yes" to script, then "Use Shooting Script," then "Transcript Complete"
- If "Not" to script, then "Make a Transcript (3 Options)"
- "Pay A Vendor" then "Transcript Complete"
- "Hire a Typist" then "Transcript Complete"
- "Speech Recognition?" then "Transcript Complete"

