Global Climate Change and Ozone Depletion: Elijah Garcia

Annual Greenhouse Gas Index (AGGI) over time

This graph from the NOAA’s Annual Greenhouse Gas Index shows that there is an apparent increase in greenhouse gases that are being released into the atmosphere. From the graph we can conclude that it took about 240 years (1760-2000) for the AGGI to reach 100% and carbon dioxide is by far the largest contributor to the AGGI in terms of both amount and rate of increase compared to any other greenhouse gas. On the left side of the graph you can see that the parts per million (ppm) is also being added in when it comes to the CO2 emissions as a greenhouse gas. You can measure the AGGI in many different ways. The way this data is collected often through radiative forcing, which is “the change in the amount of solar radiation, or energy from the sun, that is trapped by the atmosphere and remains near Earth.” The change in radiative forcing from constantly changing concentrations of twenty greenhouse gases such as carbon dioxide, methane, nitrous oxide, and 17 others is the indicator for the AGGI (GlobalChange).

The importance of this parameter is the fact when the AGGI increases, so does the average temperature of the Earth. In 2019, the AGGI was at 1.45, which is the CO2 equivalent to 500 ppm. The IPCC (Intergovernmental Panel on Climate Change) suggests that at a constant concentration of CO2 alone at 550 ppm would result in an average increase of the Earth’s temperature of about 3 degrees Celsius (5.4 degrees Fahrenheit). Clearly, the AGGI is something we need to be aware of as so many greenhouse gases are contributing to global warming, especially carbon dioxide.

As I previously stated, the data trend is showing that the Earth’s average temperature is increasing due to the amount of greenhouse gases that are being emitted into our atmosphere. The data shows that if we do not do anything about the greenhouse gas emissions, the Earth will start to slowly warm more and more across the globe. It is predicted that it will only take another 29 years for the AGGI to go up 45%. This is significant to humans because global warming should be a real concern of people and action needs to be taken to limit these greenhouse gases, especially CO2. As humans we are trying to create a sustainable environment to live in, but with rapidly increase temperatures from greenhouse gases, that hope begins to diminish.

Works Cited

“USGCRP Indicator Details.” GlobalChange.gov, www.globalchange.gov/browse/indicators/annual-greenhouse-gas-index

Human Health Hazards: Elijah Garcia

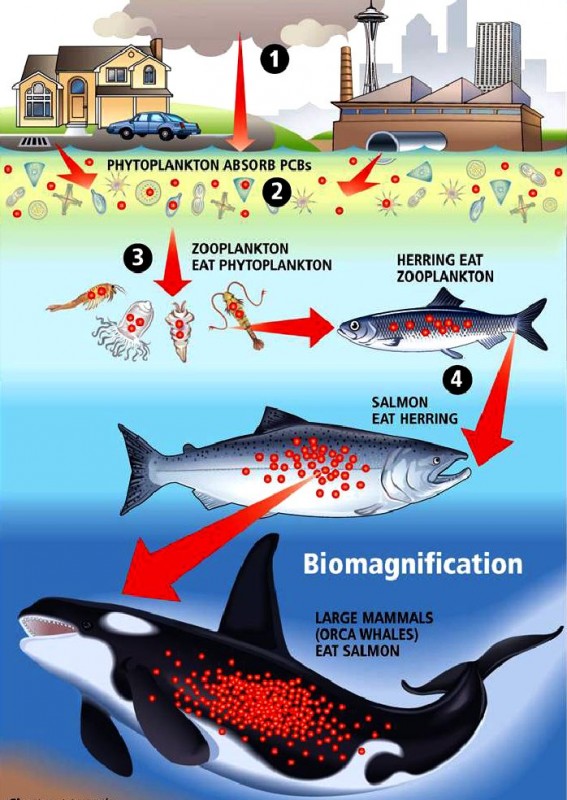
In a New York Times article that was published in September of 2018, a new study found that half of the world’s killer whale population could be wiped out due to PCBs lingering in the blubber of the whales. Because whales sit atop of the food chain, they consume the greatest concentration of chemicals like PCBs. Chemicals are taken up plankton, which are consumed by smaller fish, which are then consumed by larger fish and so on and so forth. As you progress up the food chain, chemical concentration grows leaving the whales to be most exposed (New York Times). This process is known as biomagnification. Killer whale populations in areas with low chemical levels like Norway, Alaska, and Antarctica will most likely continue to thrive, however, whale populations that are located near more industrialized areas like the United Kingdom, Brazil, and Japan are at a high risk of population collapse (New York Times). In the North Atlantic region, right whale populations have been declining at a rate of 24 whales per year ever since the population peaked in 2011 due to vessel strikes, net entanglement, and PCBs (NRDC). Researchers that completed the initial killer whale study at Aarhus University in Denmark, are also using blubber samples to estimate the amount of PCB contamination in killer whales around the globe. According to their calculations, roughly half of the killer whale populations in the world will stop increasing and slowly begin to diminish in the coming decades (New York Times). Dr. Jean-Pierre Desforges, the lead author in the study, said he could not be certain how long it would take for these populations to collapse, but his team estimated the impact of contamination over a century — and he stated that the clock started ticking about 40 years ago when PCB exposure levels were at their highest.

Killer Whales In Trouble | Youngzine Our Earth

The commercial production of PCBs started back in 1929 but its use has either been banned or severely restricted in multiple countries since the 1970s and 1980s after discovering the devastating harm and risks they pose to the environment and human health. The main source of PCBs and their pollution to the environment include: landfills containing transformers, capacitors, and other PCB waste, incineration of municipal waste, and PCBs can evaporate from contaminated water bodies (Green Facts). Although the use and manufacturing of PCBs has been banned worldwide since the 1980s, they have been used as an insulating material in electric equipment, such as transformers and capacitors, and also in heat transfer fluids and in lubricants. PCBs have also been used in a wide range of products such as surface coatings, inks, adhesives, flame-retardants, and paints (Green Facts). Not only do PCBs have a seriously negative impact on the environment and animal life, but the harmful impact towards humans is also a main reason why PCBs were banned. Since 1976, 50 studies have been conducted and have indicated increased mortality rates due to certain cancers of the digestive tract, liver, and skin from the PCBs (Green Facts). In addition, PCBs have been proven to have negative impacts on human reproduction and fertility for women. In a study of New York women, a decrease in the ability to conceive was observed amongst those who regularly ate locally-caught fish that were contaminated with PCBs (Green Facts). Finally, men who were to eat PCB contaminated fish would have a lower number of natural killer cells and a weakened immune system (Green Facts). As you can see, PCBs are dangerous chemicals that still roam the Earth today and have major environmental and human impact.


Works Cited

5, ESturgeon October, and Sheppard1002 October 4. “Killer Whales In Trouble.” Youngzine, 3 Oct. 2018, youngzine.org/news/our-earth/killer-whales-trouble.

October 27, 2020 Francine Kershaw. “Right Whales Suffer Precipitous Decline.” NRDC, 28 Oct. 2020, www.nrdc.org/experts/francine-kershaw/right-whales-suffer-precipitous-decline.

“PCBs Polychlorinated Biphenyls.” PCBs: 1. What Are PCBs?, 2021, www.greenfacts.org/en/pcbs/l-2/1-polychlorinated-biphenyls.htm.

Weintraub, Karen. “Killer Whales Face Dire PCBs Threat.” The New York Times, The New York Times, 27 Sept. 2018, www.nytimes.com/2018/09/27/science/killer-whales-pcbs.html.

Waste Management and Recycling: Elijah Garcia

Paper and paperboard materials are used most often by Americans in everyday activities and routines. Paper and paperboard products include nondurable goods like tissue paper, newspapers, paper plates, cups, and office papers. Containers and packaging products like milk cartons, corrugated boxes, bags, and sacks, are also considered paper and/or paperboard products (EPA). All of these products are included in the piece of pie that is considered paper and paperboard products when the total MSW in the United States is calculated.

Americans use paper and paperboard products so often that it makes up 23.1% or 67,544,400 tons of the Total MSW in the United States, which was the greatest portion of MSW generated in the United States in 2018 (EPA).

In 2018, the United States recycled 46 million tons of paper and paperboard for a recycling rate of 68.2 percent, which was the highest compared to other materials in MSW (EPA). In the last 10 years we have recycled on average 45 million tons of paper and paperboard products, which is much greater than the averages of either combusting the material for energy recovery or simply putting paper products in landfills. Compared to countries like China and India, which make up 36% of the world’s population, have a far less recycling rate than the United States who only make up 4% of the world’s population. China recycles their paper and paperboard products at a rate of 49% as of 2019 and is steadily increasing, while generating 52.44 million tons of paper waste at the same time (Statista). India recycles their paper products at a measly rate of 30% as of 2019, while producing 14 million tons of paper waste (Shastri). I picked these two countries because of the size of their populations compared to the United States and their relativeness to the United States in terms of developed countries.

There are actually many advantages of recycling paper products which include: saving energy, water, and landfill space. However, probably the most important reason to recycle paper is that it reduces greenhouse gas emissions and the recycled fiber is a sustainable, cost-saving resource for making new paper products. When paper decomposes anaerobically in landfills, it produces gas methane into the air. In addition, when trees are cut down to make paper products, more carbon dioxide is released into the air than is absorbed. Recycling paper waste reduces methane and carbon dioxide in the atmosphere which help limits the contribution to global climate change (Blue).

One of the main reasons that the recycle rate for paper waste is so high is that it takes 70% less energy and water than to create new paper products (Green). Because recycling paper takes very little energy and resources, it is more efficient to just recycle it rather than throw it away and let it decompose in landfills. It takes much more effort and resources in order to recycle things like metals or glass. Ways to increase the recycling rate of paper waste even more so is to encourage the use of the three R’s: reduce, reuse, and recycle. In addition, industries and office companies can do their part by maximizing all office recycling opportunities and integrate recycling policies into their companies to further encourage and engage their employees in recycling initiatives.


Blue, Marie-Luise. “The Advantages of Recycling Paper.” Education, 29 Sept. 2016, education.seattlepi.com/advantages-recycling-paper-3440.html.

Green, Jenny. “How Does Recycling Paper Help the Environment?: Shred-It UK.” Shred, Shred-It, 28 July 2015, www.shredit.co.uk/en-gb/blog/sustainability/how-does-recycling-paper-help-the-environment.

“Paper and Paperboard: Material-Specific Data.” EPA, Environmental Protection Agency, 15 Dec. 2020, www.epa.gov/facts-and-figures-about-materials-waste-and-recycling/paper-and-paperboard-material-specific-data.

Shastri Associates. Indian Paper Industry – Paper Recycling Plants, Services & Scrap Recyclers, brownoverseas.com/indian-paper-industry.htm#:~:text=The%20recycle%20rate%20in%20India,increase%20in%20scrap%20fiber%20required.

Wong, Published by Samantha, and Dec 7. “China: Paper Recycling Rate 2019.” Statista, 7 Dec. 2020, www.statista.com/statistics/1076772/china-paper-recycling-rate/#:~:text=Paper%20and%20cardboard%20recycling%20rate%20in%20China%202009%2D2019&text=In%202019%2C%20the%20recycling%20rate,in%20China%20reached%2049%20percent.

Energy Efficiency and Renewable Energy Resources: Elijah Garcia

Whether you drive your car to go to work, take the bus to get to school, or order something online to be shipped to your house, vehicles are a major part in our lives, but unfortunately we must power these vehicles with an energy resource by the name of petroleum. Over the last 70 years, the United States is consuming on average an astounding 20 million barrels of petroleum barrels per day, where the transportation sector is responsible for roughly 70% of those barrels over the industrial, residential, commercial, and electric power sectors(EIA).

U.S. consumption of petroleum products by sector

In addition, since petroleum takes millions of years to form and replenish and we use it way faster than it regenerates, making it a nonrenewable resource, we are on pace to use up all of the oil and oil reserves in the world, which will deplete a key energy source (Molles, p.165). Research suggests that the amount of oil in the world could be gone as soon as within our own lifetimes. Based upon BP’s prediction back in 2014, there are about 1.688 trillion barrels of petroleum left in the world, which is enough for 53 years of oil globally (Nasdaq). In order to preserve the precious and limited petroleum we have left, people of the world must look for an alternative source of energy to run the world we live in and especially the way we travel.

Transitioning to an alternative fuel source is not easy, but most definitely doable. If we can stop relying heavily on petroleum to fuel large portions of our society’s sectors, we can preserve our petroleum supply and possibly find more efficient energy sources that could be more beneficial in the long term. One alternative energy source is biofuels. The production of biofuels, or “combustible liquid fuels from biomass”, have increased approximately 650% between 2000 and 2010 and are starting to be used for multiple sources of energy. These biofuels are being used as additives to gasoline, which is reducing the amount of petroleum needed for the transportation sector. Ethanol, one of the most common biofuels, is used as a gasoline additive to help with the extreme use of petroleum. A product referred to as cellulosic ethanol is expanding the energy resource options even more so. Cellulosic ethanol is the process by which biomass refineries convert wood and other cellulose-rich materials into ethanol (Molles, p.308). Cellulosic ethanol has an EROEI (energy return on energy investment) that is 10 times greater than corn ethanol and is close to the EROEI of gasoline from conventional oil. Although, the cost of cellulosic ethanol was 30% higher than corn-based ethanol in 2013, the price is falling drastically and now is on par if not below the cost of corn ethanol in 2020 (Molles, p.324). With so many possibilities on the horizon in terms of alternative energy resources replacing petroleum, I believe that we are on a good path to sustainability in terms of oil consumption in the transportation sector.


Works Cited:

Molles, Manuel Carl, and Brendan Borrell. Environment: Science, Issues, Solutions. W. H. Freeman Macmillan Learning, 2016.

Publisher Zacks. “How Much Oil Is Left In The Earth?” Nasdaq, 27 Dec. 2017, www.nasdaq.com/articles/how-much-oil-left-earth-2017-12-27.

“U.S. Energy Information Administration – EIA – Independent Statistics and Analysis.” In the United States, Most Petroleum Is Consumed in Transportation – Today in Energy – U.S. Energy Information Administration (EIA), 2 Aug. 2019, www.eia.gov/todayinenergy/detail.php?id=40752.


The Cost of Non-Renewable Energy Resources: Elijah Garcia

One of the most common and destructive coal mining practices used is calling mountaintop removal. Mountaintop removal is used on steep terrain, such as the Appalachian Mountains, to uncover large deposits of high-quality coal that lie beneath the surface. The environmental impacts from this monstrosity of a coal mining practice are immense and will have lasting consequences for decades to come. The first step of mountaintop removal is to clear-cut forests on the mountain, which destroys habitats for animals and lumber resources across the terrain. The next step involves using large explosives to break up the rock that covers the desired coal deposit. The consequences of blowing up these mountains and dumping waste into streams is detrimental.  The EPA estimated that by 2012, mountaintop removal had destroyed 1.4 million acres of Appalachian forest. This means not only lost wildlife habitat, but also the steady disappearance of a forest system that naturally captures and holds carbon dioxide, one of the greenhouse gases responsible for climate change, what scientists call a “carbon sink.” One study argues that rapid deforestation in the southern Appalachian mountains could convert the region from a net carbon sink to a net carbon source by 2025 to 2033. In addition to this, the Appalachian mountains contains “one of the most diverse assemblages of plants and animals found in the world’s temperate deciduous forests.” (Appalachian Voices). The use of mountaintop removal is killing off wildlife, destroying habitats, and creating abnormalities in the waters that are destroying all sorts of marine life. Water downstream of mountaintop removal mines has significantly higher levels of sulfate and selenium, and increases in electrical conductivity. These changes in water quality can directly kill aquatic species, or disrupt their life cycles so severely that populations diminish, or even disappear (Appalachian Voices).

In addition to the various environmental impacts that mountaintop removal has on its surroundings, the multiple health impacts on humans plague communities that are located around mining sites that utilize this mining technique. A lot of these health impacts can be and are fatal and are a result of mountaintop removal mining. Higher cancer rates, respiratory diseases, heart attacks and cardiovascular diseases, and shortened lives are all serious conditions that residents around these mine sites often contract. More statistically, 60,000 cases of cancer in Appalachia have been directly linked to mountaintop removal. Additionally, heart disease is the leading cause of death in Appalachia coal mining communities and overall mortality rates are significantly higher in areas with mountaintop removal (Appalachian Voices).

The specific value of all these environmental and health impacts cannot be specifically pinpointed, however, the cost of mountaintop removal is of immense amounts. Back in 2016, the Obama administration adopted and implemented the Stream Protection Rule. This rule required coal companies to monitor and restore streams to their natural and healthy state before they were impacted by mountaintop removal mining. After a government-funded study, it was found that it would cost 52 million dollars to implement the rule (Coal Mine Next Door). Since then, this rule has been repealed by the Trump administration, however this type of law is what we need to keep these coal mining companies responsible for their actions. Although it may raise the price of the resource because of the companies extra money going into replenishing the ecosystems after damaging them, the greater picture will be worth it when we are able to live more sustainably by keeping these ecosystems intact and healthy. These consequences from mountaintop removal mining obviously have detrimental results. The least these companies can do is to fix what they have damaged.

Mountaintop Removal Site Could Become Kentucky's Largest Solar Farm -  EcoWatch

“Community Impacts of Mountaintop Removal > Appalachian Voices.” Appalachian Voices, appvoices.org/end-mountaintop-removal/community/#:~:text=The%20impacts%20on%20communities%20of,cancer%20and%20other%20health%20issues.

“Ecological Impacts of Mountaintop Removal > Appalachian Voices.” Appalachian Voices, appvoices.org/end-mountaintop-removal/ecology/.

“Human Health Impacts > Appalachian Voices.” Appalachian Voices, appvoices.org/end-mountaintop-removal/health-impacts/#:~:text=Living%20in%20heavily%20mined%20areas,mountaintop%20removal%20and%20lung%20cancer.

Stanley, Kenny. “A Mountaintop Removal Site near Pikeville, Kentucky.” EcoWatch, 2017, www.ecowatch.com/coal-mine-solar-farm-2368328309.html.

“The Coal Mine Next Door.” Human Rights Watch, 27 May 2020, www.hrw.org/report/2018/12/10/coal-mine-next-door/how-us-governments-deregulation-mountaintop-removal-threatens.


Ecological Footprint Slovenia: Elijah Garcia

After researching multiple countries on Global Footprint Network’s Open Data Platform, Slovenia popped out to me as very interesting. After a financial crisis in 2008, which brought Slovenia’s gha (global hectares) to an all-time high, the country was able to recover and bring their gha to an all-time low in 2013-2014. In addition, the Ecological Footprint of Slovenia has decreased 5.7% overall (Footprint Network).

The following image shows the financial crisis’s environmental impact as it brought Slovenia’s ecological footprint to an all-time high of 5.8 gha (Open Data Platform).

Data from 2014 shows that Slovenia has been able to drop their ecological footprint to 4.6 gha per person (Open Data Platform).

The decrease of ecological footprint in Slovenia is mostly due to the increase in carbon Footprint and forest product Footprint (Global Footprint Network). Slovenia has only started working with the Global Footprint Network in 2018, so they are pretty self-sufficient in restoring and preserving their environmental impact. However, their financial crisis was a big reason of the spike in gha in 2008 and recovering from that definitely was able to diminish their economic footprint.

The help from the Global Footprint Network after noticing that their economic footprint was on rise after 2013 and showed no signs of decreasing. Shown by Open Data Platform, in 2017, Slovenia’s footprint rose to 4.8 gha (shown below), which was not as high as it was in 2008, but still was cause for concern and some extra help.

Although Slovenia’s global footprint is on the lower side, they are still considered well over their biocapacity per person and the Global Footprint Network gave the government 4 policy recommendations (Global Footprint Network).

  1. Energy efficient urban planning, including net-zero buildings
  2. Transition to low carbon renewable energy systems
  3. Prioritize forest management to preserve biocapacity
  4. Prioritize regenerative agriculture to enhance cropland biocapacity


Works Cited

Global Footprint Network. (2020, August 31). Slovenia. Global Footprint Network. Retrieved January 28,2021, from https://www.footprintnetwork.org/2020/08/31/slovenia/.

Open Data Platform, data.footprintnetwork.org/#/?