Air and Water Pollution: Johanna Tirone

Photochemical smog is formed when pollutants such as VOCs (volatile organic compounds) and nitrogen oxides react to sunlight. Forming a brown colored fog at ground level, photochemical smog is a product of emissions from the combustion fossil fuels as well as sunlight. Nitrates created from the combustion of fuels react with sunlight to create ozone. Ozone at the troposphere, earth’s lowest layer of the atmosphere, is extremely dangerous, even though it is safe higher in the atmosphere. This means that we breathe in all of the pollutants released in photochemical smog. Photochemical smog is a secondary pollutant, due to the reaction between the nitrates and the sun.

Photochemical Smog: History & Summary | SchoolWorkHelper

Photochemical smog is most likely to form in urban areas with a lot of sunlight. Places like Los Angeles and Miami are very susceptible to photochemical smog, as they are big cities with sunlight year round. Photochemical smog even earned the nickname “Los Angeles Smog” upon its discovery in Los Angeles in the 1940s.

One of the most harmful aspects of photochemical smog is its impact on human health. The pollutants that we breathe due to the smog are VOCs, nitrogen oxides, sulfur dioxide, and ozone, just to name a few. These chemicals can cause heart and lung disease as well as long lasting respiratory issues (Photochemical Smog- What It Means For Us). Another negative effect due to photochemical smog is the fact that it significantly reduces visibility. This makes travelling, particularly driving, extremely dangerous due to the higher risk of accidents and death. Also, in terms of city aesthetic, photochemical smog makes cities less visually appealing, and could deter people from visiting the area.

In Mexico City, a hotspot for photochemical smog, has implemented measures to prevent the smog. According to the article, “Mexico’s Mega City Advances the Fight for Cleaner Air,” “Mexico City government has continued to strengthen vehicular emissions control with advanced technologies and surveillance programs, including Green inspectors and remote sensors to identify high emitting as well as non-compliance vehicles; improve fuel quality for both diesel and gasoline; improve public transportation (Metrobus); equip buses with newer diesel technologies; introduce Hybrid and electric taxis; improve mobility through bike-sharing program (Ecobici) and enhanced pedestrian areas.” In addition to these steps, Mexico has also taken further steps to cleaner energy, reducing the amount of emissions released from the burning of fossil fuels.


References:

Gardner, Sarah. “LA Smog: the Battle against Air Pollution.” Marketplace, 14 July 2014, www.marketplace.org/2014/07/14/la-smog-battle-against-air-pollution/.

“Mexico’s Mega City Advances the Fight for Cleaner Air.” Climate & Clean Air Coalition, 13 Aug. 2018, www.ccacoalition.org/en/news/mexicos-mega-city-advances-fight-cleaner-air#:~:text=Mexico%20City%20government%20has%20continued,diesel%20and%20gasoline%3B%20improve%20public.

“Photochemical Smog- What It Means For Us.” EPA Information, Mar. 2004, www.epa.sa.gov.au/files/8238_info_photosmog.pdf.

William Anderson (Schoolworkhelper Editorial Team), “Photochemical Smog: History & Summary,” in SchoolWorkHelper, 2019, https://schoolworkhelper.net/photochemical-smog-history-summary/.


Energy Efficiency and Renewable Resources- Johanna Tirone

Petroleum is a depleting resource, and the transportation sector in the United States uses most of the available petroleum. As petroleum is a nonrenewable resource, it cannot replenish itself before humans use all of the resource. Petroleum is a fossil fuel, and it takes millions of years to create. Despite the amount of time required for petroleum and other fossil fuels to be recreated in the earth, it is still the most used energy source for transportation. With the development of technology, we can begin to shift our energy sources from nonrenewable to renewable, if only the finances and effort are put in.

A way to combat the petroleum issue is to convert to solar energy. Using photovoltaic cells to convert sunlight into energy, cars that use solar energy are called ‘solar cars’ (Vyas). They are electric cars that have solar panels on the roof of the car, which charge when the car is in the sun. Not only do these cars not require petroleum, but it relies solely on the electricity produced from the sun (Vyas). The energy is then stored in the car battery for use. These cars are still in the prototype stages and initially may be out of budget for many car owners, but may decline in price over time. However, money would be saved on buying fuel, as it would not be required for the car to run. Also, solar cars do not produce harmful emissions or even noise (Vyas).

How much energy required to drive a solar car is based on how far you typically drive. According to an article from EnergySave titled, “How Many Panels Do You Need For Your EV,” most energy cars need around 4,000 kWh per year, and most solar car panels provide around 320-330 Watts. The article also states that “pulling all of these data points together creates a range of solar panels required to power different types of EVs each year in different regions. Depending upon where you live, charging an electric vehicle typically requires 7 or 9 solar panels. ” This is because it is sunnier in some areas in the United States than it is in others. As you can see in the chart (EnergySave), there are less solar panels needed for cars in states in the southwest. This is a potential drawback to a wide adoption of solar cars, as it is not always sunny in many parts of the country. However, even converting to solar cars in the sunnier areas can make a difference in overall petroleum use.

Even though the initial cost of solar cars may be high, as more research and money are put into the production for solar energy, the average cost for consumers will go down over time. Investing in solar powered cars could be a very realistic solution to the petroleum issue.


Resources:

https://interestingengineering.com/all-you-need-to-know-about-solar-powered-cars

https://www.dasolar.com/solar-energy/solar-powered-cars#:~:text=Like%20solar%2Dpowered%20homes%2C%20solar,straight%20to%20an%20electric%20motor.&text=Solar%20cars%20use%20photovoltaic%20cells%20to%20convert%20sunlight%20into%20energy.

https://news.energysage.com/how-many-panels-do-you-need-for-your-ev/


Mineral Resources- Johanna Tirone

Discovered in 1793, the Elizabeth mine is an abandoned copper mine located in Orange County, Vermont. According to the Untied States Environmental Protection Agency, “the ore was initially valued for its iron content, and then its pyrrhotite content from which copperas (iron sulfate) was produced. Circa 1830, the deposit was primarily exploited for its copper content based upon the recognition that a significant amount of chalcopyrite (copper iron sulfide) was disseminated in the pyrrhotite.” The mine was used from the early 1800s until early 1958. It produced 100.5 million pounds of copper in its lifetime.

The mine is restricted from use because there is a level of contamination found at the site. There is a high level of waste at this site, as there are mine tailings piles, waste rock piles, and heap leach piles. Due to the waste, acid mine drainage and metal (iron and copper) contaminated the nearby water that ran through local communities. The effects of this water contamination are detrimental to human health. According to First Nations Environmental Health Innovation Network, because the water is contaminated, it can cause lung and skin issues if consumed.

Cleanup at the Elizabeth mine included treated the water contaminated by the mine, as well as converting the site into 27 acres of solar arrays in order to generate energy. While this was an expensive project for the community, the cleanup process reduced about 99% of the copper and iron levels in the water, as well as powering about 1,200 homes in Vermont (VTDIGGER). The cleanup process at this mine site not only corrected the water contamination, but reversed its environmental impact.

Elizabeth Mine solar 1

References:

https://cumulis.epa.gov/supercpad/SiteProfiles/index.cfm?fuseaction=second.Cleanup&id=0102071#bkground

Long-running Elizabeth Mine Superfund cleanup begins final phase – VTDigger

Acid-Mine-Drainage-FNEHIN.pdf (focs.ca)


Food and Water Resources- Johanna Tirone

Washing dishes is a necessary chore in keeping a home clean. When washing the dishes, many people leave the faucet on throughout the duration of the cleaning process. While this may leave dishes completely spotless, it also wastes a lot of water. On average, hand washing one load of dishes uses 20 gallons of water (Water Footprint Calculator). If you hand wash dishes for three meals every day, you use 60 gallons of water each day washing dishes alone. Annually, this adds up to 7,300 gallons of water. A more efficient way to wash dishes is to use a dishwasher appliance. Not only can dishwashers wash more dishes and silverware at once, water- and energy-efficient dishwaters use as little as 4.5 gallons  per load (Water Footprint Calculator). In comparison to hand washing dishes, dishwashers can wash all of the dishes for the day at once for less than five gallons of water. Using a dishwasher can add up to only 1,642.5 gallons of water per year. On average, this saves 5,657.5 gallons of water each year.

If you do not own a dishwasher and prefer/cannot afford to purchase one, you can still save water while washing the dishes. To do so, be conscious of how much water that is being used. Turn off the faucet after filling up a basin of water to use to clean the load of dishes.

Water Use Chart

According to the chart above from the Fairview Oregon Official Site, dishwashers only make up 1% of the average household’s water usage. Faucets, on the other hand, make up 19%.  Dishwashers are more water efficient than hand washing dishes, as they use and waste less water. Without the constant running of the faucet, an efficient dishwasher uses only the amount of water necessary to clean dishes. On a domestic level, using a dishwasher to wash dishes can save a significant amount of water.


References:

“Saving Water Indoors.” Saving Water Indoors | Fairview, OR – Official Website, fairvieworegon.gov/492/Saving-Water-Indoors.

“Saving Water While Washing the Dishes.” Water Footprint Calculator, 17 Apr. 2020, www.watercalculator.org/posts/dish-washing/.

Teirstein, Zoya. “Dishwash vs Hand Wash: Which Method Is Better for the Environment?” Grist, 12 Nov. 2020, grist.org/climate/science-dishes-out-an-answer-on-the-old-handwashing-vs-dishwasher-debate/.

Population Control in Peru- Johanna Tirone

In the mid 1990s, the president of Peru, Alberto Fujimori, created the “Voluntary Surgical Contraception Campaign” in attempts to control birth rates in Peru. This was created initially as a way to suit the economic needs of the country, as there were many poor indigenous people whom the government could not support. Although this campaign was advertised as voluntary, hundreds of thousands of women were forced to be sterilized. Many women were sterilized without their consent, and local clinic workers strongly encouraged women to stop having children once they already had five. Food was withheld from families who did not comply, and the lack of regulation and safety protocol caused physical and mental trauma in Peruvian women.

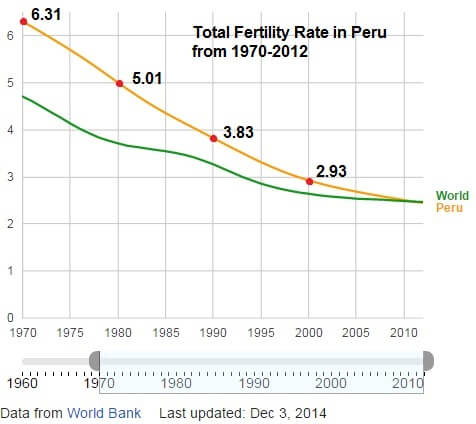
As Peru is considered a developing country, it had very high fertility rates compared to the world average in 1970. As shown in the graph, results from the forced sterilization brought Peru’s fertility rate down to the world average in 2102.

Fertility rates in Peru declined steadily even before the sterilization program was implemented. (Image created from World Bank data using Google Public Data explorer tool)

While the efforts technically succeeded in their goal of decreasing Peru’s fertility rate, they were very damaging to Peru’s society. Many of the procedures done were illegal, unsafe, and unethical. The president was arrested and tried for many crimes including the violation of human rights.


References:

Clowes, Brian (2017, January 26). “Exposing the Global Population Control Agenda.” Retrieved 5 February 2021 from https://www.hli.org/resources/exposing-the-global-population-control/?gclid=CjwKCAiA9vOABhBfEiwATCi7GHZErA6byHKqJ2OJSKwY9OABskfUHzd9FSCZjErHzlFHX08emMWFdBoCBMoQAvD_BwE

Lizarzaburu, Javier (2015 December 02). “Forced sterilisation haunts Peruvian women decades on.” Retrieved 5 February 2021 from https://www.bbc.com/news/world-latin-america-34855804

Suresh, Arvind (2014 December 11). “Forced sterilization in Peru: Did modern eugenic practices slow population growth?” Retrieved 5 February 2021 from https://geneticliteracyproject.org/2014/12/11/forced-sterilization-in-peru-did-modern-eugenic-practices-slow-population-growth/

The Ecological Footprint of France: Johanna Tirone

France, along with many other European Union countries, has become a world leader in developing policy for better sustainability. The Paris Agreement, founded in France, holds the opportunity for 196 countries to be held accountable for their part in climate change. I found it very surprising when I researched and saw that France is actually ranked as having the ninth largest ecological footprint in the world as of 2013 (Pignataro 1).

As shown in the graph above, most of France’s ecological footprint is made up of its carbon emissions at 56% percent of its total. Although France does not have the largest ecological footprint in the world, it has some of the highest percentages of crop land and grazing land in its overall footprint. This is because France is Europe’s leading country in agriculture. France has the highest utilized agricultural acreage (UAA) in Europe and produces the most amount of agricultural goods (Ministère de l’Agriculture et de l’Alimentation). This would make sense, as France is very famous for their luxury cheeses and fine meats!

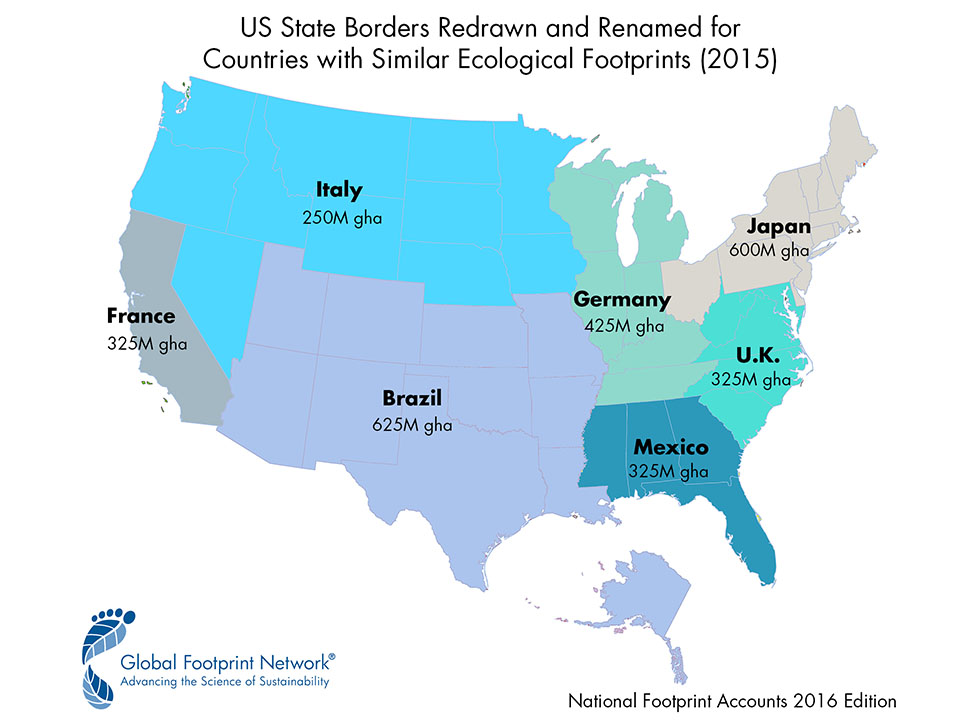
When compared to the United States, France’s ecological footprint does not seem as looming, but in 2015, France’s footprint was about the same size as California’s (Global Footprint Network). Studies have also shown that these ecological footprints also correspond with the Gross Domestic Product of each country shown on the map (Global Footprint Network). This further proves that the type of lifestyles held by areas or regions directly impacts their ecological footprint.

France has taken steps to better its sustainability and lessen its carbon emission by promoting more energy efficient methods of transportation. Biking and walking are highly encouraged, and many people ride segways! Also, the Paris Agreement set in place will give France stricter guidelines to sustainable living. We will most likely not see the effects of a more sustainable lifestyle in the near future, but hopefully France’s efforts lessen their ecological footprint.

Sources:

Global Footprint Network. (2017, January 31). California has the same size Ecological Footprint as France. How do other states and countries compare? Retrieved from https://www.footprintnetwork.org/2017/01/31/california-size-ecological-footprint-france-states-countries-compare/

Ministère de l’Agriculture et de l’Alimentation. (2015, September 22). Overview of French Agricultural Diversity Retrieved from https://agriculture.gouv.fr/overview-french-agricultural-diversity#:~:text=France%20has%20the%20biggest%20utilized,third%20in%20pig%20meat%20production.

Pignataro, J.R. (2017, May 02). 5 Worst And Best Countries For The Environment Ranked By Ecological Footprint Retrieved from https://www.ibtimes.com/5-worst-best-countries-environment-ranked-ecological-footprint-2533559

World Wildlife Fund. (2015, December 14). Landmark Climate Deal Struck in Paris. Retrieved from www.worldwildlife.org/stories/landmark-climate-deal-struck-in-paris.