Global Climate Change and Ozone Depletion- Lily Pershica

This figure illustrates the Surface Radiation Budget Network (SURFRAD) meteorology of Penn State Pennsylvania. This data and plot was taken from the Earth Systems Research Laboratories website; https://www.esrl.noaa.gov/gmd/grad/surfrad/met_check.php

There are 5 mini plots within the large plot demonstrating different parts of climate over the last 24 days. Since it is nearly impossible to research the climate of every single place on earth, scientists created SURFRAD to help. SURFRAD picks up on different climate activity within a specific area to help researchers come to conclusions about the climate. In this SURFRAD plot the specific things being tested (from top to bottom) are the wind speed (mph), wind direction (degrees), temperature (ºF), pressure (mbar), relative humidity (%).

The multiple different parameters are important to global climate change because it gives specifics to all the different aspects that go into the climate. It is one thing to look at the temperature and how that has changed over time, being able to see all the different variables helps give more information towards the bigger idea. By looking at wind speed and direction, one can tell that over time it has been speeding up which is an indication of climate change. Temps, humidity, and pressure are rising all indications of climate change (Harvey 2019).

To add onto what was previously stated, the trends shown on the plot are clear indications of climate change. It is hard to conclude to that just by looking at plots that cover 24 days, but with further outside research one can see the patterns. This hurts humans because if temps keep rising, life forms will start to die and perhaps thousands of years from now the earth could become too hot that it is not livable conditions for humans (Harvey 2019). As the climate changes, the potential risks for humans increases.


References

Harvey, Chelsea. “The World’s Winds Are Speeding Up.” Scientific American, Scientific American, 19 Nov. 2019, www.scientificamerican.com/article/the-worlds-winds-are-speeding-up/.

US Department of Commerce, NOAA. “ESRL Global Monitoring Laboratory – Global Radiation and Aerosols.” NOAA Earth System Research Laboratories, 1 Oct. 2005, www.esrl.noaa.gov/gmd/grad/surfrad/met_check.php.

Human Health Hazards- Lily Pershica

Toxaphene is a pesticide that has dangerous harms to the environment and human and animal health. Toxaphene was a widely used pesticide for cotton, crops, and livestock. By 1990, all uses of toxaphene were cancelled in the United States. The major effect to human health from exposure to toxaphene is central nervous system stimulation, which results in seizures. A more longterm effect from inhalation exposure of toxaphene is respiratory toxicity. Oral exposure in animals can result in damage to organs such as the liver, kidneys, spleen, ect. Although Toxaphene has been banned for nearly 30 years, there are still presence of the pesticide in the environment today.

In 2015, the EPA and Hercules Inc. agreed on a plan for cleanup of the remaining toxaphene that was contaminating the creeks and marshes surrounding the Pinova chemical plant. A large part of the remaining concentrations of toxaphene show up in the sediments and fish tissues, this is most likely a result of the outfall ditch. A plan was created for Hercules Inc. to build a lined outfall ditch that will direct the flow of the canal away permanently. The material used would be added and compacted slowly which would burry the sediment and toxaphene under layers of clean earth. However, this brings up a concern of potential contamination of groundwater. The EPA and Hercules Inc. will continue to discuss plans for next steps before going through with one. Although the toxaphene is still present in bodies of water, there is progress being made to rid of the pesticide.

Resources

Dickson, Terry. “Hercules, EPA Agree on Second Cleanup of Toxaphene Contamination of Terry Creek.” The Florida Times-Union, The Florida Times-Union, 12 Dec. 2015, www.jacksonville.com/article/20151212/NEWS/801258917.

EPA. “Toxaphene.” Https://Www.epa.gov/Sites/Production/Files/2016-09/Documents/Toxaphene.pdf.

Waste Management and Recycling Blog- Lily Pershica

In the United States about 25% of waste is recycled. Glass is a product that can and should be recycled. In the United States the rate of glass recycling is 31.3% with over 3.1million tons of glass recycled in 2018. Although this seems like a decent number, there is still room for growth in the United States when it comes to recycling glass.

The main glass product that is recycled is glass bottles, but there are more products as well, some examples: jars, glass containers, beer and wine bottles, and even ceramic products like plates.

In 2018 the total amount of glass waste in the United States was 12,250,000 tons and out of that 3,060,000 tons was recycled; about 31.3%. Compared to other developed countries, the United States is on the lower end of percentage of glass recycling. Switzerland, Germany, and other European countries have a recycling rate of about 90% when it comes to glass, that is almost 3 times more than the United States.

Glass can be recycled endlessly, recycled glass can sometimes be referred to as cullet. One advantage of recycling glass is there are less effects on the environment. For every 10% of glassmaking cullet is used, 5% of CO2 emissions are cut. CO2 is a greenhouse gas that causes many environmental concerns, by using recycled glass to form new glass, emissions can be cut down significantly.

The rate of glass recycling in the United States is <65% because many Americans are not familiar with the importance of recycling this product. Many Americans throw things out without knowing what potential harm it could produce such as batteries, lightbulbs, and glass. Simply knowing your local rules and regulations when it comes to waste can increase the recycling rate.  In US cities where rules are given to recycle glass, the recycling rate increases to 98%. I think a good way to promote glass recycling is creating local incentives and designated areas for citizens to recycle their glass. This has proven to be beneficial as in areas with regulations the recycling rate has increased.

Resources

C&EN, cen.acs.org/materials/inorganic-chemistry/glass-recycling-US-broken/97/i6.

“Glass: Material-Specific Data.” EPA, Environmental Protection Agency, 21 Sept. 2020, www.epa.gov/facts-and-figures-about-materials-waste-and-recycling/glass-material-specific-data.

Air and Water Pollution Blog- Lily Pershica

There are two major types of smog; Industrial and photochemical smog. Both pose a threat to the health of humans, the environment and other living things. Today, I will focus on photochemical smog.

Today the majority of the smog we see is photochemical. It is formed when sunlight reacts with nitrogen oxides, which are chemical compounds made of different combinations of nitrogen and oxygen, and at lease one volatile organic compound or VOC. A VOC is gas released from a solid or liquid that has potential to cause harm to people and the atmosphere. To sum up the formation process, nitrogen oxides and a VOC react to sunlight and become smog. An example of this process is when you drive a car. Nitrogen oxides are released from the exhaust while VOCs are released from the gasoline, then when sunlight hits these chemicals it forms airborne particles, thus creating smog.

Smog has many negative impacts on human, plant, and animal health and the environment. One way in which it effects human health is through the respiratory system. A mild effect would just be slight trouble of breathing and coughing but those symptoms would be gone within days. However, the effect could get so bad as to reduce lung function and trigger asthma, therefore potentially permanently damaging the health of a person. Besides the serious health effects smog may produce, it also creates a gross brown and grey tint to the sky harming the beauty of the planet. This is especially true in big cities like New York city or Hong Kong.

China has tried to reduce their smog through implemented programs. These programs include installation of equipment to remove harmful matter, replacing coal with natural gas, and expansion of clean energy vehicles. By following these programs, slowly change will be able to be seen in China.

Resources

“China: Fighting Air Pollution and Climate Change through Clean Energy Financing.” World Bank, www.worldbank.org/en/results/2020/06/21/china-fighting-air-pollution-and-climate-change-through-clean-energy-financing#:~:text=Reduce%20air%20pollution%20emissions%20through,and%20expanding%20clean%20energy%20vehicles.

EPA. Smog—Who Does It Hurt? What You Need to Know About Ozone and Your Health. www.airnow.gov/sites/default/files/2018-03/smog.pdf.

National Geographic Society. “Smog.” National Geographic Society, 9 Oct. 2012, www.nationalgeographic.org/encyclopedia/smog/#:~:text=Photochemical%20smog%20is%20produced%20when,power%20plants%2C%20and%20factory%20emissions.&text=When%20sunlight%20hits%20these%20chemicals,%2Dlevel%20ozone%E2%80%94or%20smog.


Energy Efficiency and Renewable Energy Resources- Lily Pershica

The current situation with petroleum is that the United States is one of the largest consumers, consuming nearly 26% of the world’s oil supplies. The average person living in the United States consumes about 3/4 of a barrel of oil per day. This oil usage habit of the United States is one of the many reasons why the source of petroleum is slowly declining. The Transportation sector of the United States is a huge reason why petroleum usage is so high. In order for a vehicle to work it needs gasoline which is petroleum. The more people who fill up their cars with gasoline the more petroleum is extracted and the quicker the decline of the resource.

I propose a solution that the United States can take to reduce their use of petroleum in the transportation sector. Although the United States cannot control the decisions their citizens make when it come to shopping for cars, they can control their own. If all police cars and other government owned cars were electric, there would be a huge decrease in petroleum usage. In the city of Brookhaven, Georgia with a population of 55,554 people, the police department spends an average of $228,000.00 per year on gasoline for their vehicles. This is one city with a lower population, imagine the total amount of money spent on gasoline in the United States as a whole. Since each police department pays for their own gas, that number is not public but I guarantee it is a lot. The money amount is just a proportion to the gallons of gas used. Although that information is not public, we can estimate using the average gas price in Georgia, $2.582 per gallon. $228,000.00 divided by $2.582 is approximately 88,303.64 gallons of gas used per year inBrookhaven Georgia. If every city went from using gas powered cars to electric vehicles in their government vehicles, the amount of petroleum used would decrease. Especially since police departments are slowly moving toward SUVs rather than Sedans, this switch is vital to preserving petroleum. The price point on Electric vehicles may seem scary but if the Brookhaven police department were to make the switch they would actually be saving about $1.2 million over the course of 6 years so it would be a beneficial investment for the United States.

To conclude, the resource of petroleum is slowly dwindling down. If the United States were to start to make changes in their own departments, citizens may follow and the rate of petroleum’s declination would hopefully slow down.

References:

Electric Vehicle for Police Operations Proof of Concept . Brookhaven, Georgia , www.brookhavenga.gov/sites/default/files/fileattachments/sustainable_brookhaven/page/21291/ev_comparison_report_may_2020.pdf.

Klender, Joey. “Tesla Model 3 Police Car Is so Effective, People Getting Pulled over Love It.” TESLARATI, 5 Jan. 2020, www.teslarati.com/tesla-model-3-police-car-long-term-review/.

Robinette, Eric. “More Police Departments Choosing SUVs over Sedans.” Journal, Journal News, 19 Dec. 2013, www.journal-news.com/news/more-police-departments-choosing-suvs-over-sedans/c3aQRxlU5Y5g6iAwwM6jEP/.

“State Gas Price Averages.” AAA Gas Prices, 6 Nov. 2017, gasprices.aaa.com/state-gas-price-averages/.

Class Lecture Notes

Nonrenewable Energy Resource Blog- Lily Pershica

Nonrenewable energy resources are accountable for the majority of energy use in the world. Coal makes up 41% of the global electrical generation and about 24% of energy resources. Needless to say, the world relies on coal for a large portion of energy use. However, when it comes to extracting coal, the approach of strip mining can be harmful to the environment and human health. Strip mining and coal are not the only extraction of non-renewable resources that cause harm, in fact the majority of techniques of non-renewable resource extraction cause some harm. Therefore I believe that the environmental and health costs associated with non-renewable resource extraction should be included in the price of the resource.

I will be specifically analyzing strip mining as it relates to the this claim. Strip mining is defined by the textbook as “a coal extraction technique in which overburden is removed from a long strip of land, exposing a coal seam”. The aftermath of this process leaves the land extremely scarred and increases the acidity of the water that is drained from the strip min land which is known as acid mine drainage. This can damage aquatic ecosystems. By adding a cost to coal for the harm strip mines created to the environment would allow for more money to restore the land and help clean up the aftermath as much as possible.

Just like any other type of coal mining, strip mining can cause harms to human health. According to West Virginia Public Broadcasting, “Hendryx and collaborating researchers published numerous studies that linked mining to a variety of health issues for those living nearby, including increased rates of cancer, lung disease, and birth defects.” This supports the claim because even though no monetary worth can be put on human lives, by increasing the cost of coal the extra money can go to help cover medical expenses and recovery of those whose health was compromised due to strip mining.

References

Molles Textbook

Frequently Asked Questions (FAQs) – U.S. Energy Information Administration (EIA), www.eia.gov/tools/faqs/faq.php?id=427&t=3.

West Virginia Public Broadcasting | By Glynis Board. “Strip Mining Science: Trump Administration Stops Mining Health Study.” WVPB, 25 Aug. 2017, www.wvpublic.org/news/2017-08-25/strip-mining-science-trump-administration-stops-mining-health-study.

Mineral Resource Blog- Lily Pershica

The Mariano Lake Mine is located in Mariano Lake chapter of the Navajo Nation which is just east of Gallup, New Mexico. Mariano Lake Mine was working from 1977 to 1982 by Gulf Mineral Resources Company (now Chevron). It had two different mining areas, an eastern area and a western mining area that was used as a dewatering pond. When open, about 505,000 tons of uranium ore was mined.

During the removal site evaluation, contamination was mainly found within a fenced area. However, there was also contamination east of the Eastern Mine Area and under the perimeter roads. The primary contaminants polluting this site are uranium, radium, and arsenic. The levels of the pollutants pose a potential health risk to the community.

Although the mine closed in 1982 it was not until 2012, Chevron completed a removal action and investigation of the site. Then, in 2016 interviews were held with Chapter officials and community members on their thoughts and opinions on next steps. In 2017, the EPA joined forces with Navajo Nation to oversee Chevron and come up with a plan to address the mine site.  EPA and Chevron have been informing community members in Gallup, New Mexico of their plan to clean up the Mariano Lake Mine Site.

Resources

https://www.epa.gov/navajo-nation-uranium-cleanup/mariano-lake-mine


Food and Water Resources- Lily Pershica

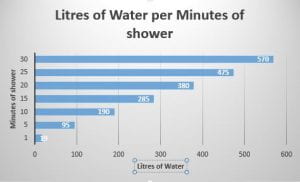
We all (hopefully) shower multiple times a week. When showering, according to Boston University, for every minute your are in the shower five gallons of water are used. I tend to take on average ten minute showers, that means that I use fifty gallons of water each shower. Multiple that by the number of days a week and I use about 350 gallons of water per week just by showering. If I simply reduced my shower time to five minutes I would cut that total water usage in half, not only saving water, but also energy. Since we prefer to shower in warm water, we also use energy. According to the Washington Post,  water heating itself accounts for almost 17 percent of total home electricity. With all of this is mind, taking a shorter shower would be a simple first step to reducing your water footprint plus also a bonus of saving energy.

As you can see in the graph above a ten minute shower uses about 190 liters of water, simply cutting your shower time in half brings it down to 95 liters of water, you would save half the amount of water. 

Now the question is how do you reduce your shower time because for many of us it is hard to leave the warmth of the water after five minutes. The Shower Power organization came up with a few tips on how to make this transition to shorter showers easier. Play a song and by the time it is over you know to wrap up your shower. Use a water saving app that will time you and have some sort of reward for the shorter shower you take. Overall, at the end of the day you are saving a little bit of the planet by using less water and energy and plus you will save a little money.

Resources

“Important Announcement.” Sustainability Take Shorter Showers Comments, www.bu.edu/sustainability/what-you-can-do/ten-sustainable-actions/take-shorter-showers/.

Mooney, Chris. “Your Shower Is Wasting Huge Amounts of Energy and Water. Here’s What You Can Do about It.” The Washington Post, WP Company, 29 Apr. 2019, www.washingtonpost.com/news/energy-environment/wp/2015/03/04/your-shower-is-wasting-huge-amounts-of-energy-and-water-heres-what-to-do-about-it/.

“Shower Power.” Shower Power – Take Shorter Showers – Do Nation, www.wearedonation.com/do-actions/shower-power/#water.

Brazil Population Blog- Lily Pershica

Brazil is one of the largest countries in the world and the largest country in South America in terms of land. With that in mind it is also one of the most populated countries. According to nationsonline.org Brazil is the 6th most populated country in the world and the most populated in South America with a population of 212,228,000 as of 2020. Brazil took charge and created efforts to reduce their population growth. The government created and is promoting the “adolescence first, pregnancy after” campaign that has a goal to reduce the teenage pregnancy rate.  This strategy to reduce birth rate in Brazil is a strong force and a lot of support behind it among different groups of people. This campaign shows teenage girls that they can do more than just be a mother and because of this the feminist movement in Brazil has latched onto and helped the government spread awareness to the campaign. It also supports the idea of abstinence which many religious organizations also favored. Given all the groups that support this campaign there really has been no difficulties and backlash besides that of teenagers. Although this campaign has been successful in citizen support, it has not been very effective at decreasing the population growth rate.

As you can see by this graph the exponential rate of growth has slowed down but the population is still increasing. According to BBC, this campaign has had an impact but not one significant enough to change the increasing pattern. With the examination of this graph and the information above it is clear that this campaign is favored in society but has not made a significant impact yet to the growing population. However, this is just one effort, as Brazil creates more and time goes by the impact will be more defined.

Resources

Nationsonline.org, Klaus Kästle -. “From the World’s Most Populated Countries to the Least Populated Nations – Nations Online Project.” Population Figures for All Countries 2019-2020 – Nations Online Project, www.nationsonline.org/oneworld/population-by-country.htm.

“Seven Countries with Big (and Small) Population Problems.” BBC News, BBC, 15 July 2020, www.bbc.com/news/world-53424726.

Watson, Katy. “All in Good Time: Why Brazil Wants Its Teens Not to Have Sex.” BBC News, BBC, 5 Feb. 2020, www.bbc.com/news/world-latin-america-51370684.

Ecological Footprint: Lily Pershcia

The ecological footprint of a country says a lot about the development status of that country. When looking at data on the  Global Footprint Network I was curious to see how the two politically competing hegemonies, China and United States, compared when it came to ecological footprints. Since the United States relies on China for many imported goods and services, I was interested to see if that would factor into China’s footprint as well.

I used these two graphs to gain my information.

This chart represents the ecological footprint of the country.

This chart represents the ecological footprint of each person in the country.

By looking at these two graphs I created the observation that currently China has a greater population and a greater ecological footprint as a country than the United States. However, when looking at the ecological footprint per person in the designated country, the United States towers over China in ecological footprint, even though the population is smaller. With this I concluded that trade and production of products in China probably has a factor on their ecological footprint.

According to the CCICED-WWF Report on Ecological Footprint in China, as the economy in China increased, the amount of CO2 emissions increased as well. As the United States is one of the main characters in the China economy, the demand from the US for Chinese products has some fault in this rapid increase. Since China does not use renewable resources, like wind or solar power, to power these operations their ecological footprint is dramatically increasing.

From examination of the data charts above, I was able to conclude that even though China has a larger population the country as a whole has a larger ecological footprint than the United States. However, the ecological footprint per person is larger in the US than in China. The reason behind China’s large ecological footprint is largely due to the US lifestyle and the demand for China-made products.

Resources:

Kitzes, J. (n.d.). Report on Ecological Footprint in China. Retrieved 2021, from https://d2ouvy59p0dg6k.cloudfront.net/downloads/chna_footprint_report_final.pdf

https://data.footprintnetwork.org/?_ga=2.49044390.1656159128.1611937083-1798263005.1611937083#/SocioEconomics?cn=5001,231,351&type=BCtot,EFCtot&misc=pop