‘Human Health Hazards’ blog entry Matthew Soska

Molly Taft wrote an article about how “Underwater Roombas” are cleaning up DDT that is seeping out of old barrels dumped in the pacific. A large manufacturer of DDT had been dumping the barrels for years and in 2000, after a lawsuit was filed, they found the rumours to be true (Taft, 2021). Starting with Rachel Carson’s Silent Spring in 1962, there was a huge outcry to ban DDT which was successful in the mid-1970s. 

The reason DDT was banned is because of bioaccumulation. It starts in the water and makes its way up the food chain. Also, it can be found in the environment for 2 to 15 years at least (Taft, 2021). After that it breaks into DDE or DDD. This has negative consequences for both humans and animals. One of the effects DDT has is it deprives birds of calcium. This has been the reason egg shells have thinned down and thus harming bird populations. Finally, it can kill aquatic invertebrate species. Examples are: stoneflies and crayfish. 

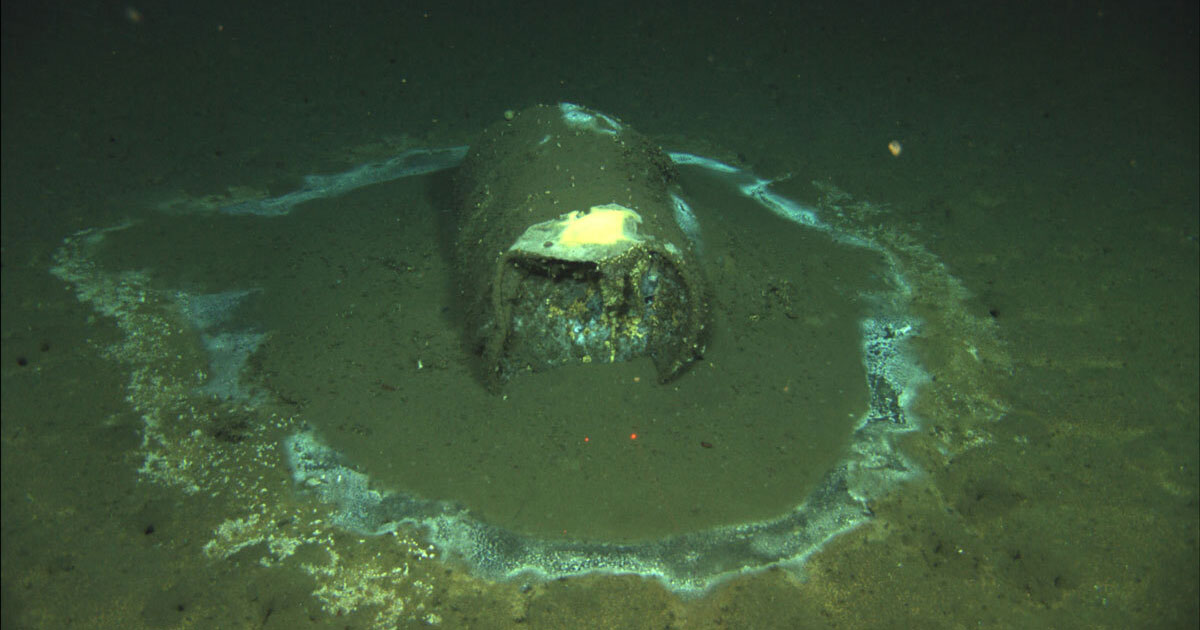
An accumulation of around half a million barrels has devastated Catalina Island sea life. Scientists have sent down robots equipped with sonar radar to assess the damage these barrels have caused. They’re on a 12-16 week mission to gather data from the biosphere in order to better assess possible solutions. 

Although DDT was banned in the 70’s, it’s still in the environment today. It was developed during the 1940s to help both the military and civilians fight insects that carried diseases like malaria and typhus (EPA, 2021). Moreover, it helped protect crops and gardens from insects as well (EPA, 2021). Its success in its intended purpose caused it to be used widespread in the United States. This overuse is the reason it’s still in the environment today even though its illegal. DDT is not naturally occuring so all of it in our ecosystem is because of human use. It comes from people spraying it and companies disposing of it (as noted in Taft’s article). 

There is no link between low doses of DDT and adverse health effects in humans (CDC 2017). DDT in high doses, however, can cause vomiting, tremors, and shakiness (CDC, 2017). DDT is a possible human carcinogen (CDC, 2017). Most people are exposed through eating food and touching contaminated surfaces. Because it’s so wide-spread, DDT has been found in infants from their mothers and even breast milk. 

Sources 


  1. Taft, Molly(2021).‘’Underwater Roombas’ Help Start Cleanup of Decades-Old Toxic Waste Dump Along California Coast”. Retrieved from: https://earther.gizmodo.com/underwater-roombas-help-start-cleanup-of-decades-old-to-1846457859 
  2. EPA(2021).‘DDT – A Brief History and Status”. Retrieved from: https://www.epa.gov/ingredients-used-pesticide-products/ddt-brief-history-and-status
  3. CDC(2017). “Dichlorodiphenyltrichloroethane (DDT) Factsheet”. Retrieved from: https://www.cdc.gov/biomonitoring/DDT_FactSheet.html 


Waste Management and Recycling’ blog assignment

Today, plastic is in a lot of the products we use. The obvious products being things like water bottles, children’s toys, and containers. However, there are a myriad of products that you wouldn’t suspect contain plastic, but do. These products include: coffee cups, tea bags, and chewing gum!(Steyn 2019)

In 2018, 35,672,800 tonnes of MSW were generated as a result of plastic production (EPA 2018. Moreover, 91% of that plastic waste produced is not recycled and is instead dumped (Parker, 2018). How does the U.S compare to the rest of the world? First, it’s only fair that America is compared to other developed countries. The reason being is that an undeveloped country may not have the same needs as a first world one. Also, the countries should be similar sizes so population needs are adjusted for. Looking at the image below, we see that the U.S recycled only a fraction of the plastic waste we produced (e.g in 2018, ~3,000,000 million tones were recycled out of the ~27,000,000 million tonnes landfilled) (EPA 2018). In Germany, for example, 48.8% of all plastic waste is recycled and in the UK it’s around 45% (Wecker 2018). This is a trend that can be seen when looking at most other developed countries in Europe, North America, and the Pacific. 

There are a plethora of monetary advantages when it comes to recycling plastic. First, a lot of other materials go into disposing of plastic waste. For example, it’s estimated that for every one ton of plastic we recycle, we can save 1,000 to 2,000 gallons of gasoline (This is plastics, 2021).  Statistics like these are indicative of a possibility of  a more sustainable economic model. Also, recycling oriented policies are advantageous because they’re effects aren’t as harsh. Things like banning plastic bags only hurts small businesses (increased costs) and low-income customers (This is plastics, 2021). Recycling things like plastic bags  doesn’t have as much of  an impact on people’s day to day lives and creates more opportunities for economic growth. Finally, in general it expands on an industry and creates more jobs. Having a recycling rate of 75% could create ~1.1 million jobs by 2030 (ecocycle, 2019). 

As previously mentioned, the United States has incredibly low rates of recycling plastic. There are a few reasons why that is. First, plastic can become contaminated which means it can’t be processed at facilities (Cho, 2020). Also, plastic has to compete with virgin plastic which is difficult because of how cheap virgin plastic is (Cho, 2020). Finally, China banned most plastic from being shipped to them. Historically, the U.S has shipped the plastic to China and they recycled it for cheap (Cho, 2020). China eventually became fed up with having to keep all of the unrecyclable plastic and banned most from being imported(Cho, 2020). This has made it more expensive for the U.S (Cho, 2020).

My suggestion would be to regulate the plastic before it’s sent over. China hasn’t said they wouldn’t take it-they just want stricter standards. If the U.S could inspect the plastic beforehand and ensure there isn’t a contaminated batch, we can strengthen our trade deals with China. 


Sources

  1. Steyn,Rita(2019).”The 10 Hidden Plastics You Didn’t Know About”. Retrieved from https://www.themarinediaries.com/tmd-blog/the-10-hidden-plastics-you-didn-t-know-about 
  2. Hannah Ritchie and Max Roser (2018).“Plastic Pollution”.Retrieved from: ‘https://ourworldindata.org/plastic-pollution’
  3. The Environmental Protection Agency (2018).Facts and Figures about Materials, Waste and Recycling.Retrieved from: https://www.epa.gov/facts-and-figures-about-materials-waste-and-recycling/guide-facts-and-figures-report-about-materials#Materials 
  4. Parker, Laura (2018).“A Whopping 91% of plastic isn’t recycled”.Retrieved from: https://www.nationalgeographic.com/science/article/plastic-produced-recycling-waste-ocean-trash-debris-environment
  5. Wecker, Katharina (2018). “Plastic waste and the recycling myth”. Retrieved from: https://www.dw.com/en/plastic-waste-and-the-recycling-myth/a-45746469 
  6. This is plastics (2021). “The potential of recycled plastics”. Retrieved from: https://thisisplastics.com/environment/the-potential-of-recycled-plastics/ 
  7. Ecocycle (2019). “Zero Waste creates jobs”. Retrieved from: https://www.ecocycle.org/zerowaste/jobs
  8. Cho, Renee (2020). “Recycling in the U.S is broken. How do we fix it?”. Retrieved from: https://blogs.ei.columbia.edu/2020/03/13/fix-recycling-america/ 


Air and Water Pollution Blog Entry

What is Photochemical Smog?

Photochemical smog is formed when nitrogen and oxygen are combined and heated up (Deziel, 2018). This forms Nitric Oxide (Deziel, 2018).  For example, the engines in our automobiles produce NOx all the time (ICCT, 2017). Once NOx is in the air, it combines with sunlight to make NO which combines with oxygen (Sher, 1998). This pairs up with O2 to form ozone or O3 (Sher, 1998). In most basic terms, when Nitrogen Oxide reacts with organic compounds and are catalysed by sunlight, then photochemical smog is formed (Deziel, 2018).


What are the effects of Photochemical Smog? 

In the short term, photochemical smog has negative health effects for those around it (Charmaine, 2018). The smog can irritate one’s lungs (especially for the really young and old), make it difficult to breath, trigger deadly asthma attacks, and reduce lung function (Charmaine, 2018). In the long term, excessive exposure to photochemical smog can facilitate the development of lung and heart disease in children and the elderly (Charmaine, 2018). 

Photochemical smog can have serious effects on buildings. The chemicals in the smog break down materials like sandstone, limestone, mortar, and various types of metal (GOC, 2010). This is especially problematic for older buildings and monuments since they don’t have protective coats like modern structures (GOC, 2010). Smog can hurt home owners as well (GOC, 2010). Things like aluminum siding and paint erode faster because of smog and home owners need to replace them more often (GOC, 2010). In the US alone, the cost of repairing structures that have been destroyed by smog was 5% of our GDP (or $790 billion dollars) (Robinson, 2019). 


What is being done about it?

Because one of the biggest producers of this smog are cars, Mexico City has issued a no drive day once a week (Hinckley 2016). The strategy is two-fold. First, on the surface, having less cars driving on the road will lead to less pollution produced. The second, however, is to familiarize people with public transportation (Hinckley 2016). People in Mexico City may not have known where their bus top is, for example, before this one day ban. Lastly, this is the least invasive way to do it. People don’t need to radically change how they live, they just need to change for one day a week. The system assigns cars stickers (Hinckley 2016). So for example, Wednesday, cars with a yellow sticker can’t drive. Continuing, on Wednesday, maybe someone with a yellow sticker hitches a ride to work with someone who has a red sticker. It fosters a culture of  conciseness.  

Image: 

Chart of emissions

“External damages from fine particulate matter air pollution by economic sector and precursor pollutant for 2008, 2011, and 2014 (in billions of dollars, 2018-adjusted).” 

Sources 


  1. Deziel,Chris(2018).How is Photochemical smog formed. Retrieved from https://sciencing.com/components-smog-4233.html
  2. The International Council on Clean Transportation(2017).How NOx happens, and why you should care. Retrieved from https://theicct.org/cards/stack/vehicle-nox-emissions-basics 
  3. Sher, Eran(1998). Handbook of Air Pollution From Internal Combustion Engines. Retrieved from https://www.sciencedirect.com/topics/earth-and-planetary-sciences/photochemical-smog 
  4. Charmaine,Mike(2019).Effect of Photochemical Smog. Retrieved from https://sciencing.com/effect-of-photochemical-smog-12328963.html 
  5. Government of Canada (2010). Air pollution damage to infrastructure and industry. Retrieved from https://www.canada.ca/en/environment-climate-change/services/air-pollution/quality-environment-economy/economic-issues/damage-infrastructure-industry.html 
  6. Robinson, Ellis (2019). How much does air pollution cost the US. Retrieved from https://earth.stanford.edu/news/how-much-does-air-pollution-cost-us#gs.vzwael 
  7. Hinckley, Story (2016). How Mexico City plans to fight air pollution. Retrieved from https://www.csmonitor.com/World/Global-News/2016/0403/How-Mexico-City-plans-to-fight-air-pollution 


Mineral Resource Blog Entry

In Kent, New York there is an old mine that was used for obtaining Arsenic (EPA, 2020). The mine is half located in a state park, and half located on private property (EPA, 2020). Just down the mountain where the mine sits, are residential areas (EPA, 2020). 

In the late 80s, after residents started to become sick, the EPA started testing soil on the mountain around the mine (EPA, 2020). They found that there were high levels of arsenic in the soil and required the owners to put up warning signs (EPA, 2020).The EPA did not find it necessary to test the water (EPA, 2020). In 2016, after repairing a cistern, the EPA found that the container had been broken for years and arsenic had been entering the water (EPA, 2020). Residents were shocked when the problem just started to get taken seriously in 2019 because people had been getting sick, and some reportedly dying, for 32 years(NBC NY, 2019). 

In the short-term, high levels of arsenic in water and soil can cause people to have stomach issues like vomiting or cramping (common amongst residents in Kent) (WHO, 2018). Also, for the more vulnerable, it can lead to numbness, tingling, and death (WHO, 2018). Arsenic is a carcinogen (WHO, 2018). That means that in the long term, people can develop a myriad of cancers (mostly skin) (WHO, 2018). Other long term health effects include, but are not limited to: pulmonary disease, hyperkeratosis, and cardiovascular disease (WHO, 2018).  

The EPA’s current plan has been more concerned with quarantining the site, getting people out of the area, and studying the water and soil to develop a plan (EPA, 2020). After studying the best course of action, the EPA proposed a plan that was then published for people in the area to comment on (EPA, 2020). On or about May 2020, the plan was finalized and on June 29, 2020, it was put into action (EPA, 2020). The EPA first started to buy up property that had a high concentration of arsenic and moved the residents to a new permanent location (EPA, 2020). After the removal of people, the houses were promptly demolished (EPA, 2020). The properties will not be able to be bought until the soil and water is safe (EPA, 2020). Currently, the EPA is trying to find the best way to clean up the arsenic by studying the soil and water (EPA, 2020)


Sources


  1. United States Environmental protection Agency (2020). Arsenic Mine Kent, NY. Retrievedfrom https://cumulis.epa.gov/supercpad/SiteProfiles/index.cfm?fuseaction=second.Cleanup&id=0202816#Done 
  2. NBC New York (2019).NY Town Gets EPA Cleanup 32 Years After Arsenic Discovered Due to Mine from 1800’s. Retrieved from https://www.nbcnewyork.com/news/local/epa-proposes-cleanup-for-ny-town-contaminated-with-arsenic-due-to-mine-from-1800s/1483560/ 

   3. World health Organization (2018). Arsenic. Retrieved from       https://www.who.int/news-room/fact-sheets/detail/arsenic 

Population Blog: China

China has one of the largest populations in the world; clocking in at around 1,439,000,000 (Worldometer, 2020). Because their population is so large, China has struggled with issues like pollution, land management, and poor living conditions- especially in cities(Cook, 1999). These issues led to family planning policy that has received strong criticism over the years- especially their one child rule.  

In 1979, the Chinese Communist Party declared that all couples could only have one child and before they had that child they had to get approval from the state (Maverick, 2020). After having that one child, parents were responsible for using birth control to prevent another one. The most common method was, and still is IUD (Maverick, 2020). If a couple broke the rules, a multitude of punishments could be dished out. This includes, but is not limited to: punitive fines, forced abortions, and forced sterilization for repeat offenders(Tasch, 2015). 

Moreover, because the family planning agencies were local entities, the agencies would set up something akin to a neighborhood watch. Neighbors were encouraged to spy on couples and make sure they didn’t have any unregistered children. On top of that, employers were allowed to legally fire or deny raises and bonuses if an employee had more than one child (Tasch, 2015). As of 2016, China has allowed citizens to have two children and they no longer need to go through as many steps. This policy change stems from a declining workforce (Maverick, 2020).

So, did this policy work? I can’t really say. It is true that China’s population did decrease but, the population decreased in a lot of countries around the world. Also, in the graphic, we can see that China’s total fertility rate was already on a decline. Moreover the TTFR stays closer to three. The reason being is only 40% of citizens could only actually have one child. There were a lot of exceptions. For example, people who were an only child could have more than 1 baby (Tasch, 2015). I can’t put together a solid argument that says whether it is/was effective and I can’t really argue that it is/wasn’t ineffective. 

This policy is hard to justify. Every person has a right to control their own body. Punishing people because they decided to have children is immoral and wrong. What would be a wiser strategy that doesn’t violate human rights is to encourage people to have less kids by offering something in return. For example, giving $2,000 equivalent to married couples who decide to only have one child. Overall, this was a difficult policy to abide by for the people of China.  


Sources: 


  1. Maverick, J.B(2020).A Look at How China Controls Its Population. Retrieved from https://www.investopedia.com/articles/investing/081715/look-how-china-controls-its-population.asp 
  2. Worldometer(2020).China Demographics. Retrieved from https://www.worldometers.info/demographics/china-demographics/ 
  3. Cook, Jaimie(1999).Population Control and Consequences in China. Retrieved from http://maps.unomaha.edu/Peterson/geog1000/Sidebar/ChinaPop.html
  4. Tasch, Barbara(2015).The consequences of violating China’s one-child policy were sometimes horrific. Retrieved from https://www.businessinsider.com/what-happened-when-people-violated-the-one-child-policy-2015-10 

Ecological Footprint Blog: Brazil

Matthew Soska

Having been friends with a lot of people from Brazil (I have done Brazilian Jiu-Jitsu for years) I could hardly believe that Brazil’s Ecological Footprint was so low. All my life I have heard how this beautiful and abundant country has been abused by big corporations and global superpowers. After some further research, I found that because of years of strong environmental policy and Brazil’s willingness to work with the Global Footprint network, they have been able to keep their footprint low and biocapacity stable. 

In the early 60s, Brazil’s ecological footprint was roughly 178,700,00 (Global Footprint Network). Despite years of industrialization and growing multinational corporations, in 2017 they clocked in at a low 588,103,141(Global Footprint Network). Even more impressive is that they were able to grow their biocapacity (even if modestly)(Global Footprint Network). The only concerning trend is that their ecological footprint is growing at a quicker rate than their biocapacity(Global Footprint Network). 

Brazil’s success isn’t as shocking when you look at their history of fighting for strong environmental policy. In the late 70s and early 80s, after concerns about deforestation became salient amongst Brazil’s intelligentsia, country leadership decided to incorporate promises to the environment in their new constitution. This includes, but is not limited to: building powerful environmental agencies, designating untouchable national parks/reserves, and committing to attend the Earth Summit (Brazil:A Country Study). 

One can see the effects of these policies by looking at the graphic. The sharpest increase in biocapacity was from 1970 to 1980; when these laws were being implemented(Global Footprint Network). Even after that rapid growth, biocapacity grew steady for the next eight years (Global Footprint Network). However, an important thing to note is that the ecological footprint kept and still keeps growing. Although they were able to protect their environment, they couldn’t slow down the agriculture industry and industrialization. 

Brazil’s recognition of the problem, and their ability to deal with it in a scientific manner should be used as a model for the world. Although they still struggle, when the North Pole melts, we definitely can’t point the finger at Brazil. 


Sources 

Country Trends, Brazil. Open Data Platform. Retrieved from https://data.footprintnetwork.org/#/countryTrends?cn=21&type=BCtot,EFCtot

Hudson, A., Rex(1997).Brazil: A Country Study. Retrieved from http://countrystudies.us/brazil/