‘Global Climate Change and Ozone Depletion’ blog assignment

Featured

For this blog assignment, go to the NOAA website at https://www.esrl.noaa.gov/gmd/dv/visualize.html. There you will find the Data Visualization page and a host of data plots for/on a variety of species/topics – greenhouse gases, halocarbons, ozone depletion, and more.

Your assignment is to browse a topic of interest, select a data plot (or make one of your own here: https://www.esrl.noaa.gov/gmd/dv/iadv/), place the figure into your post at the top, and comment on it in the text below.

Your post must include the following items, but is not LIMITED to these items:

  1. An explanation of the plot presented, including the type of data presented, the time frame over which the data are presented, and a BRIEF explanation of how such data are collected.
  2. The importance, or significance, of the parameter presented (such as, say, the concentration of atmospheric CO2). In other words, why does this parameter matter to global climate?
  3. An explanation of what the data trend shown means, how it is interpreted, and why it is significant to humans.

As always, you must underline facts and data (or bold-face them). DO NOT consider interpretations to be facts. They are informed opinions, not FACTS. Facts are those items that we observe directly. Similarly, hypothesis are not facts. They are suppositions.

Also remember that ALL FIGURES must have a caption, which is a brief explanation of what the figure illustrates and where it comes from (i.e., an in-text citation).

‘Human Health Hazards’ blog assignment

Featured

Environmental hazards signTable of dirty dozen chemicals

For this blog post, select one of the persistent organic pollutants (POPs) known as the “Dirty Dozen” from the table above or the list below. Find, read, and digest a recent newspaper article that discusses your chosen pollutant and its presence in the environment, its impact on humans, and/or its impact on ecosystems and wildlife. Summarize the article and its key points, including key data and facts. In addition to the points made by the article, you MUST research and include information on the following in your post:

  • The main source(s) of the chemical to the environment,
  • How and where the chemical are used by humans, and
  • The health impact of the chemical on humans.

If the table is not clear, here is a list of the POPs in the list:

  • DDT
  • PCBs
  • Dioxin
  • Furans
  • Aldrin
  • Chlordane
  • Dieldrin
  • Heptachlor
  • Hexachlorobenzene
  • Mirex
  • Toxaphene


‘Waste Management and Recycling’ blog assignment

Featured

We hear about recycling a lot, though as we will discuss in class this week, we actually do less of it than we might think in the United States. For this blog assignment, I would like you to select one material that we have the capability to recycle (e.g., paper, plastic, metal, glass, etc), and address the follow topics:

  1. What are some of the products that contribute to this class of materials?
  2. How much waste do we generate of, and to what extent do we recycle, this material in the U.S.? How does this compare to other countries? You may decide for yourself (and explain to the reader) which countries offer the most appropriate comparison.
  3. What are the advantages of recycling this material? You must put this in context using at least one of the following metrics:
    1. Money
    2. Energy
    3. Greenhouse gases
  4. If the recycling rate of this material is relatively high (>65% or so) in the U.S., why is that? If it is low (i.e, <<65%), why is that? In the former case, comment on the lessons we might learn that could be applied to other materials. In the latter case, what strategies do you suggest for increasing the recycling rate of this material?

Please organize your post so that you answer the topics in the order they are presented above. Remember that you MUST underline or bold-face ALL DATA and FACTS, and you must present a figure that you have made or found (along with appropriate references).

I suggest this URL as a place you may wish to begin your search:

https://www.epa.gov/facts-and-figures-about-materials-waste-and-recycling

‘Air and Water Pollution’ blog assignment

Featured

Asian brown cloud

SO: http://pollutionsouthasian.weebly.com/uploads/2/0/0/4/20047069/1319682_orig.jpg

As you can see from the image above, air pollution (in this case industrial smog caused by the combustion of coal – i.e., the so-called Asian Brown Cloud) is unsightly. However, it has other effects on humans that are important. In your blog post, write on EITHER of the topics below:

  1. Photochemical smog
  2. Industrial smog

Your post should discuss (including specific details):

  1. How smog forms, in enough detail that it is clear to someone who has never heard the term,
  2. At least two impacts of smog on humans (e.g., health impacts or infrastructure impacts), and
  3. A solution or strategy that has been employed to deal with smog in a specific place on Earth (such as Los Angeles, Mexico City, Beijing, etc).

As always, you should use data and facts in your post and cite all sources used properly. All data and facts should be indicated by underlining or bold-facing text.

‘Energy Efficiency and Renewable Energy Resources’ blog assignment

Featured

U.S. energy consumption by source and sector

In the U.S., according to the EIA graphic above, the transportation sector utilizes ~70% of the petroleum used in this country and petroleum energy makes up 91% of the energy used in the transportation sector.

In your blog post, summarize the current situation when it comes to the petroleum resource. Use the information from the textbook and/or lecture to set the stage. Then, propose a means by which the issue of a declining oil supply can be addressed in the Transportation sector. Be specific in your proposal, and use data and facts to support your proposed solution.

All facts and calculated values must be clearly indicated by underlining and/or bold facing. All calculations that you performed must be clearly indicated as such.

‘Nonrenewable Energy Resources’ blog assignment

Featured

Strip mining, mountaintop removal, and other techniques used to extract non-renewable resources such as coal have deleterious effects on ecosystem functioning and human health. Such effects impact the ability of natural systems to provide clean water and air and habitat for fish and other species that humans rely on for food and, in some cases, their livelihoods.

In your blog posting, take a position on the following question:

Should the environmental and health costs associated with non-renewable resource extraction be included in the price of the resource?

Support your position with facts and a well-reasoned ‘pro’ or ‘con’ argument. You must include at least one clearly explained connection between an extractive technique (e.g., mountaintop removal) and the effect it causes (e.g., enhanced erosion), and explain how this effect has a monetary cost (e.g., …).

‘Mineral Resources’ blog assignment

Featured

Mineral resources, which are crucial components of modern civilization, are extracted from ore deposits. That extraction can impact the environment in a myriad of ways by generating harmful waste, demanding energy and water, and degrading ecosystems.

Using this website (https://www.epa.gov/superfund), identify a Superfund site in the U.S. that is related to mineral resource extraction or mineral resources in general (such as a processing site). In your blog post, you should:

  1. Briefly describe the history of the site (‘where is it?’ and ‘what has occurred there?’);
  2. What is contaminated (and by what elements or compounds) and how that impacts human health (jumping off points for this topic can be found here and here); and
  3. Detail some of the major cleanup activities that have occurred at the chosen site (to give a sense of the scope of the cleanup).

You should put the information IN YOUR OWN WORDS, and communicate in the style of a newspaper article: informative (who, what, why, where, when) and to the point. Remember to cite all facts that you obtain from books, articles, or online references.

‘Food and Water Resources’ blog assignment

Featured

Research and clearly describe in suitable detail a strategy that can be used to waste less water. You may consider any use you want: agricultural, domestic, etc.

Using an online calculator (see Modules > Web Resources for examples of resources that can help) or other approach (such as a scientific study that performs such a calculation), quantify how much water the strategy you outlined could save annually.

All facts and calculated values must be clearly indicated by underlining and/or bold facing. All calculations that you performed must be clearly indicated as such.

‘Population’ blog assignment

Featured

Find, present, and explain/describe an example of a population growth strategy that has been employed by a country to convince its population to have fewer children. Comment on the difficulty of such endeavors. Use graphical content to round out your posting.

Note that all facts/data that you use in your post MUST be underlined and cited properly.

‘Ecological footprint’ blog assignment

Featured

First, watch the following short video on the Ecological Footprint: https://www.youtube.com/watch?v=_T5M3MiPfW4&feature=youtu.be.

Then, visit the homepage of the Global Footprint Network. On this website, find, present, and explain a factually-based observation or case study involving the ecological footprint (be aware of the meaning of ‘biocapacity’).

For instance, you might use the data on ecological footprint for given countries to highlight the temporal trends in footprint over time. You might compare, contrast, or otherwise explain trends in time, differences between countries, the global footprint, etc. Present a data-based figure (and cite it properly: https://www.mendeley.com/guides/web-citation-guide) and clearly discuss the point it is used to make.

Note that all facts/data that you use in your post MUST be underlined and cited properly.

‘Student Introduction’ blog assignment

Featured

Please answer the questions below in the comments section:

  • Why are you taking this course?
  • What environmental topics interest you the most?
  • In your opinion, what is the single most important environmental problem facing human civilization today?
  • What do you hope to take away from this class?
  • What are your goals for the semester?

For this particular assignment, you will not need to make your own post. Simply comment on my post to complete the assignment.

Global Climate Change and Ozone Depletion: Danielle Vickers

Graph showing monthly CO2 levels from 1975-2020

Graph showing the monthly mean CO2 Levels from Barrow, Mauna Loa, Samoa, and the South Pole. Source: Arlyn Andrews. 2020. Monthly Mean Carbon Dioxide: NOAA ESRL Carbon Cycle [Graph]. Retrieved April 9, 2021, from https://www.esrl.noaa.gov/gmd/ccgg/figures/

The graph above shows the monthly mean carbon dioxide levels from the past 50 years from the 4 baseline observatories in Barrow, Mauna Loa, Samoa, and the South Pole. For clarity, I have I marked the locations of each of the observatories on the map below with the same colors used in the graph. infographic showing location of observatories

The data shows that CO2 levels from all the observatories have been continually rising since 1970 (Andrews, 2020). This is measured by analyzing the rate of absorption of light in an optical cavity (Tans and Thoning, 2020). The repeated ups and downs throughout the pattern is from the seasons. In the summer, plants are able to absorb the CO2 in the air as the photosynthesize thus dropping the CO2 level, while in the winter, the plants die, causing the CO2 to rise again; these repeated rises and falls of CO2 are what creates the saw-tooth pattern in the trend for each location (Fantle, 2021). This also explains why places with more consistent seasons like Samoa and the South Pole have less variation in the CO2 levels throughout the year. Nonetheless, the CO2 levels across all of the observatories have been raising at very similar rates, illustrating that CO2 levels have been increasing globally (Andrews, 2020).

CO2 is a greenhouse gas that contributes to the greenhouse effect, a natural process where infrared light is trapped in the atmosphere and raises the temperature of the Earth (Molles, 2016). Although the greenhouse effect is natural, human activities like “deforestation, land use changes, and burning fossil fuel” have increase the amount of CO2 into the atmosphere by 47%, which ‘forces’ the climate to increase to unprecedented temperatures (NASA, 2021).

Because the CO2 levels shown in the graph have been continually increasing globally, it also means that the global climate must be rising as well. This can have major consequences for the environment and for the humans living in it — such as sea level rise, increase of water-borne diseases, decline or extinction of animal and plant species to name a few (Molles, 2016). Additionally, because humans are the ones causing these CO2 and climate increases, we have understand how we are contributing to the amount of CO2 being emitted into the atmosphere so that we can limit it and attempt to slow the rate of climate change.


Sources:

Andrews, A. (n.d.). Monthly Mean Carbon Dioxide: NOAA ESRL Carbon Cycle [Graph]. Retrieved April 9, 2021, from https://www.esrl.noaa.gov/gmd/ccgg/figures/
Fantle, M. (2021, April 6). Long-Term Human Impacts: Climate Change [Powerpoint].
Molles, M. C., & Borrell, B. J. (2016). Chapter 14: Atmospheric and Climatic Change. In Environment: Science, issues, solutions. W H Freeman, Macmillian Learning.
NASA. (2021, April 5). The Causes of Climate Change. Climate Change: Vital Signs of the Planet. https://climate.nasa.gov/causes
Tans, P., & Thoning, K. (n.d.). How we measure background CO2 levels on Mauna Loa. NOAA Global Monitoring Labratory. Retrieved April 9, 2021, from https://www.esrl.noaa.gov/gmd/ccgg/about/co2_measurements.html

Global Climate Change Blog – Ryan Coughlan

This data plot shows the monthly mean carbon dioxide of the Mauna Loa volcano from roughly 1960 to the present day.


In 1958, Charles David Keeling went to the Mauna Loa Observatory in Hawaii and began measuring the levels of carbon dioxide present.  As the data in the graph above shows, the amount of carbon dioxide parts per million (ppm) has increased steadily and dramatically from roughly 1960 to 2020.  In what came to be known as the Keeling Curve, the Mauna Loa data shows that the amount of carbon dioxide in the atmosphere is increasing.  By 2012, atmospheric CO2 had risen by 25% from the original recording.

Deforestation, the Industrial Revolution, and numerous other man-made factors have caused this acceleration of carbon dioxide into the atmosphere, but why does it matter?  Well, carbon dioxide and other greenhouse gases trap heat in the atmosphere.  As the sun shines down on Earth, some of the heat radiation is reflected back away from the atmosphere.  Global amounts of carbon dioxide, as demonstrated in the figure above, are increasing.  This means that more heat is being trapped and less is being reflected, causing the Earth’s atmosphere to become warmer.  This causes numerous potential problems for humans and other species as well.  The increased atmospheric temperature causes sea levels to rise because of the expanding water due to heat, and also due to glaciers melting.  A higher atmospheric temperature also lowers the pH of water, causing destruction to coral reefs and many marine habitats.  The rise in sea level will affect human beings because many places that are densely populated will soon be underwater if greenhouse gas emissions continue to rise like the figure shows.


Sources:

Molles, Manuel C., and Brendan Jonathan Borrell. Environment: Science, Issues, Solutions. W.H. Freeman, 2016.

US Department of Commerce, NOAA. “Global Monitoring Laboratory – Carbon Cycle Greenhouse Gases.” NOAA Earth System Research Laboratories, 1 Oct. 2005, www.esrl.noaa.gov/gmd/ccgg/figures/.

Global Climate Change and Ozone Depletion — David Jauregui

These graphs taken from NOAA’s website indicates the trend in CO2 concentrations in the atmosphere over time. The left one represents the recent means and the right one represents the CO2 concentrations since the 1960s. The red represents monthly values which is why the red has spikes. The black represents the average seasonal cycle which is corrected yearly to display a constant line. The X axis represents the particle parts per million while the Y axis represents time. The measurements were observed and recorded at the Mauna Loa Observatory in Hawaii. These graphs are important to climate change as it shows the rapid rise in atmospheric CO2 concentrations. It also shows that since the mid 1900s the amount of carbon emissions have skyrocketed. This much CO2 contributes a lot to global warming as a greenhouse gas which has been a constant battle as global warming has contributed to rising temperatures and sporadic weather events.

These graphs are important as it showcases that more and more carbon dioxide is being emitted every year with no signs of slowing down. This data trend is also important to us humans as it gives us a visual on just how much of an influence we have on the environment. It should give us a way to work to reduce the carbon emissions in order to see a reduction in yearly trends. If CO2 emissions continue to be increased then there will be heavy consequences in the future.

EARTH 100H: Global Climate Change Post: Freundt

  1. This is a plot of solar radiation in Mauna Loa, Hawaii  on April 8, 2021. The time frame of the data presented was taken from 2pm-2pm the following day. It measured in 24 hours the watts of the solar radiation including downwelling solar, direct normal solar, diffused solar and downwelling infrared throughout the day.
  2. This parameter presented is important because it shows how each solar measurement varies through the day and one can specifically look for when its highest or lowest, which one can notice the peak at around noon. Measurements of downwelling are important to the ocean life. Direct solar is how much solar radiation is received per unit area. Direct solar radiation is what is left hitting the earth after it has been scattered from the direct solar bean through particles in the atmosphere. Downwelling infrared is radiation which comes to earth from the clouds and molecules in the atmosphere.
  3. Being aware of solar radiation is important because it provides heat, light and energy necessary for all living organisms.

Global climate change and ozone depletion blog-Colin Hennessy

  1. The graph shown below showcases the increase in carbon dioxide (CO2) from 1997 to the most current reading in 2021. Approximately once a week air samples were collected and analyzed for the amount of CO2 found in them. And then plotted on this chart to show the changes in concentration.
  2. Carbon Dioxide is significant to look at because it is the single most abundant green house gas humans have pumped into our atmosphere. “It absorbs less heat per molecule than the greenhouse gases methane or nitrous oxide, but it’s more abundant and it stays in the atmosphere much longer.”(Climate.gov) So once CO2 is up there it is difficult to take out and contribute heavily to the global warming problem we currently face.
  3. The data shown below shows an increase in CO2 from its lowest point in 1997 of 355 to the highest recording of 420 in 2020. There is visible wave motion in this graph driven by seasonal changes which effect the uptake of CO2 and the release of it into the atmosphere. But even with the waves the average for the amount of CO2 found in each weekly sample is on the rise because of humans pumping CO2 into the air. This is a problem for all life, because more CO2 in the air has a direct correlation to an increase in the green house effect which in turn means the collective warming of our planet. This cause further problems as water levels rise as ice caps melt. I choose to focus on Greenland in particular because “the Greenland ice sheet is the second largest mass of ice on Earth, holding enough water to raise global sea levels by 7.2 metres.” which mean loss of habitat for humans and animals alike. If CO2 emissions are not decreased, dangerous repercussions for our unsustainable behavior will greet us and our next generation.

Global Climate Change and Ozone Depletion- Lily Pershica

This figure illustrates the Surface Radiation Budget Network (SURFRAD) meteorology of Penn State Pennsylvania. This data and plot was taken from the Earth Systems Research Laboratories website; https://www.esrl.noaa.gov/gmd/grad/surfrad/met_check.php

There are 5 mini plots within the large plot demonstrating different parts of climate over the last 24 days. Since it is nearly impossible to research the climate of every single place on earth, scientists created SURFRAD to help. SURFRAD picks up on different climate activity within a specific area to help researchers come to conclusions about the climate. In this SURFRAD plot the specific things being tested (from top to bottom) are the wind speed (mph), wind direction (degrees), temperature (ºF), pressure (mbar), relative humidity (%).

The multiple different parameters are important to global climate change because it gives specifics to all the different aspects that go into the climate. It is one thing to look at the temperature and how that has changed over time, being able to see all the different variables helps give more information towards the bigger idea. By looking at wind speed and direction, one can tell that over time it has been speeding up which is an indication of climate change. Temps, humidity, and pressure are rising all indications of climate change (Harvey 2019).

To add onto what was previously stated, the trends shown on the plot are clear indications of climate change. It is hard to conclude to that just by looking at plots that cover 24 days, but with further outside research one can see the patterns. This hurts humans because if temps keep rising, life forms will start to die and perhaps thousands of years from now the earth could become too hot that it is not livable conditions for humans (Harvey 2019). As the climate changes, the potential risks for humans increases.


References

Harvey, Chelsea. “The World’s Winds Are Speeding Up.” Scientific American, Scientific American, 19 Nov. 2019, www.scientificamerican.com/article/the-worlds-winds-are-speeding-up/.

US Department of Commerce, NOAA. “ESRL Global Monitoring Laboratory – Global Radiation and Aerosols.” NOAA Earth System Research Laboratories, 1 Oct. 2005, www.esrl.noaa.gov/gmd/grad/surfrad/met_check.php.

Global Climate Change and Ozone Depletion: Elijah Garcia

Annual Greenhouse Gas Index (AGGI) over time

This graph from the NOAA’s Annual Greenhouse Gas Index shows that there is an apparent increase in greenhouse gases that are being released into the atmosphere. From the graph we can conclude that it took about 240 years (1760-2000) for the AGGI to reach 100% and carbon dioxide is by far the largest contributor to the AGGI in terms of both amount and rate of increase compared to any other greenhouse gas. On the left side of the graph you can see that the parts per million (ppm) is also being added in when it comes to the CO2 emissions as a greenhouse gas. You can measure the AGGI in many different ways. The way this data is collected often through radiative forcing, which is “the change in the amount of solar radiation, or energy from the sun, that is trapped by the atmosphere and remains near Earth.” The change in radiative forcing from constantly changing concentrations of twenty greenhouse gases such as carbon dioxide, methane, nitrous oxide, and 17 others is the indicator for the AGGI (GlobalChange).

The importance of this parameter is the fact when the AGGI increases, so does the average temperature of the Earth. In 2019, the AGGI was at 1.45, which is the CO2 equivalent to 500 ppm. The IPCC (Intergovernmental Panel on Climate Change) suggests that at a constant concentration of CO2 alone at 550 ppm would result in an average increase of the Earth’s temperature of about 3 degrees Celsius (5.4 degrees Fahrenheit). Clearly, the AGGI is something we need to be aware of as so many greenhouse gases are contributing to global warming, especially carbon dioxide.

As I previously stated, the data trend is showing that the Earth’s average temperature is increasing due to the amount of greenhouse gases that are being emitted into our atmosphere. The data shows that if we do not do anything about the greenhouse gas emissions, the Earth will start to slowly warm more and more across the globe. It is predicted that it will only take another 29 years for the AGGI to go up 45%. This is significant to humans because global warming should be a real concern of people and action needs to be taken to limit these greenhouse gases, especially CO2. As humans we are trying to create a sustainable environment to live in, but with rapidly increase temperatures from greenhouse gases, that hope begins to diminish.

Works Cited

“USGCRP Indicator Details.” GlobalChange.gov, www.globalchange.gov/browse/indicators/annual-greenhouse-gas-index

Halocarbons and trace gasses in Australia


Figure 1 – Presence of CFC-113 per picomole in Cape Grim, Australia. Sourced from NOAA Global Monitoring Laboratory.

The plot presented shows how much of CFC-113, a type of CFC is present in Cape Grim, Australia. This data was collected over a period of 30 years, from 1991 to 2021. This data is collected using Flask Samples, when air is stored into flasks and then further experimented on.

CFCs are responsible for depleting the ozone layer in the stratosphere, an essential shield against the harmful rays of the UV rays that come from the Sun. As such, it is important to measure the presence of such gasses in the atmosphere. An increase in atmospheric CFC is a concern for ozone depletion.

This specific data trend shows that in Cape Grim, the presence of CFCs has been on a decline for the last two decades. It is notable that the peak happened in around 1995 and has been on a decline ever since then. This data is important because it shows that, over a period of time, the presence of CFC-113 has gone down in this specific area, meaning that the ozone layer is largely preserved.


This image requires alt text, but the alt text is currently blank. Either add alt text or mark the image as decorative.

Global Climate Change and Ozone Depletion – Leon Yang

Long term measurement of global atmospheric methane. Source: Dlugokencky, E. (2019, August 8). Carbon Cycle Greenhouse Gases. Global Monitoring Laboratory. Retrieved from https://www.esrl.noaa.gov/gmd/ccgg/figures/

The data in the graphic above was gathered from the Carbon Cycle cooperative air sampling network. They gather air into flasks from across the globe and measure them for specific gasses (Flask Logistics Lab). we can see that the global average of atmospheric methane has been increasing steadily from 1984 to 2019 (Dlugokencky, 2019). From the top plot, we can clearly see that from 1984, we have increased the amount of methane in the atmosphere by a little over 200 parts per billion (ppb) (Dlugokencky, 2019). While it may be tough to see when global average actually decreased in the top plot, we can clearly see it in the bottom plot. Whenever the global growth rate is a negative value, the global average drops. However, the global growth rate only fell negative in three separate occasions during the study, and it did not stay negative for long (Dlugokencky, 2019).

The ppb essentially relates to how much of a specific chemical is present. Since methane’s ppb is increasing, we know that there is more methane in the atmosphere than before. This is problematic because methane is a greenhouse gas. In fact, methane can absorb more heat than carbon dioxide, thus making it a more potent greenhouse gas. It is difficult to compare the two chemicals though since methane leaves the atmosphere sooner than carbon dioxide does. However, it is estimated that during the initial 20 years that methane is released, it is 84 times more potent as a greenhouse gas than carbon dioxide (Methane).

Now that we know what atmospheric methane does, let us review the plots once more. As discussed earlier, methane levels are increase globally, with no signs of slowing down. However, methane is also a very potent greenhouse gas. Combined together, we see that a major contributor towards global warming is methane.


Sources:

Dlugokencky, E. (2019, August 8). Carbon Cycle Greenhouse Gases. Global Monitoring Laboratory. Retrieved from https://www.esrl.noaa.gov/gmd/ccgg/figures/

(n.d.) Flask Logistics Lab. Global Monitoring Laboratory. Retrieved from https://www.esrl.noaa.gov/gmd/ccgg/behind_the_scenes/flasklab.html

(n.d.) Methane: The other important greenhouse gas. Environmental Defense Fund. Retrieved from https://www.edf.org/climate/methane-other-important-greenhouse-gas

Climate Change Blog Post: South Pole Ozone Hole

Figure 1: A graph comparing ozone levels at the south pole to levels present before the formation of the ozone hole sourced from the NOAA Global Monitoring Laboratory [1].  

The figure above is showing a comparison of ozone concentrations in the atmosphere above the South Pole between the years 1967 and 2017.  The x axis is the year of measurement and the y axis is the percentage of increase or decrease from the reference level (average of values between 1962 and 1978).  Three different values are plotted: the annual average in blue, the average across a reference month for each year (October) in light blue, and a trendline for the October measurements in red.  The measurement was done via The Dobson Spectrophotometer at the South Pole, which measures ozone concentration by comparing incoming amounts of light from the sun at wavelengths that are strongly absorbed by ozone with those that are not [1].

Ozone concentrations have immense implications on human life.  Observations at the South Pole are also important to establish the worldwide trend.  Ozone strongly absorbs incoming ultraviolet light which can damage human DNA and lead to skin cancer in high doses [2].  Depletion in ozone layers worldwide would lead to increases in skin cancer rates and other skin diseases.  This would also require people to stay away from sunlight more often and wear sunblock whenever possible to avoid these effects.  Chlorofluorocarbons, chemicals commonly used in refrigerators and aerosol sprays since the 1960s, were discovered to be responsible for a depletion of ozone in the atmosphere in 1985 and were subsequently banned [2].  This can clearly be seen reflected in the data, as ozone at the south pole was on a downward trend since the 1960s, reaching a minimum in 1997.  Although production was stopped earlier it took time for natural cycles to reduce the effects of chlorofluorocarbons and restore ozone.  This process is still taking place, as shown by the gradual upward trend of ozone.  While not all areas of the world were affected as significantly as the South Pole, the declining ozone concentration was still hazardous to all humans and it is for the better that it is being restored.

  1. US Department of Commerce. (2005, October 01). GML South Pole ozone hole. Retrieved April 09, 2021, from https://www.esrl.noaa.gov/gmd/dv/spo_oz/ozdob.html
  2. World of change: Antarctic ozone hole. (n.d.). Retrieved April 09, 2021, from https://earthobservatory.nasa.gov/world-of-change/Ozone

‘Global Climate Change and Ozone Depletion’ – Hendricks

These graphs from the NOAA’s Annual Greenhouse Gas Index show that there is an issue occurring by the increasing amount of greenhouse gasses getting added into the atmosphere. Focusing specifically on the bottom left graph, we can see the rise of Methane (CH4) in parts per billion, from 1975 to 2020. The measurement of the amount of methane in our atmosphere can be measured in various ways. We can measure and get the data for these graphs by looking at the point sources, external tracers, enclosed chamber data collection, and micrometeorological techniques that measure total methane emissions from individual sources/small open source areas. Satellites are able to measure various gasses while orbiting the earth. 

This parameter of rising methane collecting in our atmosphere matters to the global climate because it is creating a barrier that is trapping in heat. This is contributing too much to the greenhouse effect causing too much heat to be trapped. This causes adverse effects that largely affect climate trends and the wellbeing of the planet. This graph is important because it is showing that the amount of methane getting omitted into the atmosphere is increasing over time. This data lets us know that our production methods that release methane have become too prominent and need to be lessened. 

This data trend means that on average, more methane is being released into the atmosphere. This graph shows the ppm of methane omitted which correlates to the amount of heat that becomes trapped in the atmosphere because of the properties of the collected gas. 


Global Climate Change and Ozone Depletion: Chloe Mazer

Yearly averages of CO2 recorded at Mauna Loa, Hawaii. Retrieved from: US Department of Commerce, NOAA. (2005, October 01). Global monitoring Laboratory – carbon cycle greenhouse gases. Retrieved April 08, 2021, from https://www.esrl.noaa.gov/gmd/ccgg/trends/weekly.html

In this plot, the daily and monthly averages of CO2 prevalence at Mauna Loa, Hawaii are cataloged. The graph begins with data from March of 2020 and provides full data on every month until this past March 2021. The black dots on the graph represent daily averages, the short red lines represent weekly averages, and the blue lines comprise data from the monthly average. The graph is updated weekly, from Sunday through Saturday. The data is collected at the Observatory near the summit of Mauna Loa, at a high altitude of 3400 m, which means it is well situated to measure representative air masses. The air analyzed is from over the Pacific Ocean, and has had several days to “mix” so that the variability of CO2 pockets has diminished, and the CO2 is pretty evenly distributed. The measurements are frequently and rigorously calculated, ensuring that the measurements are as accurate as possible. The levels of CO2 are analyzed through a technique called the Cavity Rind-Down Spectroscopy (CRDS) which measures the rate of absorption of light circulating in the optical cavity. Through this mechanism, the amount of CO2 can be calculated. This instrument also measures the amount of CH4 and CO within the atmosphere.

Carbon dioxide is one of the most important long-lived greenhouse gases of our Earth. It absorbs less heat, but is more abundant and persists in the atmosphere longer. CO2 also specifically absorbs wavelengths of thermal energy that are not absorbed by water vapor, which adds to the greenhouse effect uniquely. In looking at the impact of CO2 quantitatively, the increases in CO2 are responsible for 2/3 of the total energy imbalance, which is causing the Earth’s temperature to rise. Carbon dioxide also reacts with water particles in the ocean, which lowers the ocean’s overall pH levels. The drop in pH due to this reaction is called ocean acidification (Lindsey, 2020).

Globally, carbon dioxide levels are the highest they have been in 800,000 years, with the measurement totaling 409.8 parts per million in 2019. This number is only expected to rise within the following years, with the rate of global increase being around 100 times faster than previous years. This increase in the trend of CO2 will continue to harm our climate, with temperatures expected to increase leading to a disrupted water cycle, increasing sea levels, increasing natural disaster prevalence, and destroying ecosystems. This all has profound impacts on human life and should propel us to advocating for the protection of the climate.

References:

The causes of climate change. (2021, February 08). Retrieved April 08, 2021, from https://climate.nasa.gov/causes/

Lindsey, R. (2020, August 14). Climate change: Atmospheric Carbon Dioxide: NOAA Climate.gov. Retrieved April 08, 2021, from https://www.climate.gov/news-features/understanding-climate/climate-change-atmospheric-carbon-dioxide

US Department of Commerce, NOAA. (2005, October 01). Global monitoring Laboratory – carbon cycle greenhouse gases. Retrieved April 08, 2021, from https://www.esrl.noaa.gov/gmd/ccgg/trends/weekly.html

Human Health Hazards – David Jauregui

Dichloro-diphenyl-trichloroethane, or DDT, is a synthetic pesticide that was developed in the 1940s. It was used as pest control and a way to kill off the malaria virus. At first DDT was seen as the “wonder chemical” that seemed to work like magic. Every farmer in the US used DDT on their crops which caused their farms to produce large yields. DDT was also used a public disinfectant against insect borne diseases and was used to spray down parks, beaches, and other public places. However, despite it being effecting at pest and insect borne disease control it was very effective at harming both the environment and human health. According to a recent article by the Pesticide Action Network DDT was found in 60% of heavy cream samples, 42% of kale greens, 28% of carrot produce, and 99% of blood samples from the people tested by the CDC. DDT was shown to have severe negative affects to both human and environmental health. The CDC found that DDT was causing a spike in breast cancer, reduced fertility in men, miscarriages, developmental delay, and nervous system and liver damage. In the environment there was heavy contamination in water systems which affected the fish which then affected the animals and humans that ate them. Because of DDT there was a huge reduction of bald eagle populations due to DDT thinning out the outer shells of their eggs

In the early 1960s Rachel Carson released her book, Silent Spring, with hopes of spreading awareness of the harmful effects of DDT. It initially was met with uncertainty and doubt until it caught the attention of then President John F. Kennedy who approved the formation of the Environmental Protection Agency, EPA, and banned the use of DDT with the exception of extreme special cases where DDT is absolutely necessary to use.


Sources:

https://www.panna.org/resources/ddt-story

https://www.epa.gov/ingredients-used-pesticide-products/ddt-brief-history-and-status

https://en.wikipedia.org/wiki/DDT

Dioxins, and how they impact us

A very interesting article on Dioxins by the Oxford Academic sheds light on the impact this chemical has on human health. It is a detailed article talking about the effects Dioxins have after human exposure. The article first talks about how cancer mortality has been noticed to increase invariably in humans exposed to this chemical as opposed to those who have not. In particular, it is observed that humans exposed to the chemical 2 to 3 times more than the general population show the strongest evidence for this cause. Other interesting effects are Thyroid function and effects on reproductive system where signs like low testosterone and increased gonadotrophin concentrations would be observed. It is important to know that the size of the sample used in the study was niche, and that many more effects may occur to this chemical not observed in the sample studied.

Today, Dioxins are mainly just a by- product of industrial waste. They are also released in the environment through improper waste management. Every living being has been exposed to this chemical at some point. One of the uses of this Chemical was in production of Agent Orange, a defoliant used in the Vietnam War. Dioxins are known to cause chloracne, which is now strongly linked to Dioxin exposure. It is interesting to see that Dioxin not only impacts humans, but every vertebrate species, at every stage of development.

References-


  1. M. Kogevinas, Human health effects of dioxins: cancer, reproductive and endocrine system effects, Human Reproduction Update, Volume 7, Issue 3, May 2001, Pages 331–339, https://doi.org/10.1093/humupd/7.3.331
  2. Dioxins, National Institute of Environmental Health Sciences. https://www.niehs.nih.gov/health/topics/agents/dioxins/index.cfm


Human Health Hazards: Danielle Vickers

Old image about the Thornton Spring pollution

In November 2017, Sean Yoder published an article in the Centre County Gazette that claimed the a portion of the Centre County Kepone was “declared safe for reuse and redevelopment after decades-long cleanup efforts.” This 32-acre Superfund site originally housed Rutgers Organics Corporation, a chemical manufacturing company that created pesticides, namely Mirex and Kepone, from 1958-72 (EPA, Centre County Kepone).

Mirex, or Dechlorane, is an insecticide that was created in 1961 that was also used as a “fire retardant for plastics, rubber, paint, paper, and electrical goods” (EPA, Mirex, 1992). Throughout the 1960s, Mirex was one of the most prominent pesticides used primarily in southeastern US to control fire ants and yellow jackets through aerial spraying onto soil (CDC, Biomonitoring Summary). However, Mirex is not water soluble and attaches to soil and fatty tissue, which makes it difficult to breakdown naturally and bioaccumulates in nearby animals (EPA, Mirex, 1992). Mirex can be absorbed through the skin or gastrointestinal tract, so humans are most likely to be exposed to this chemical through eating fish from contaminated waters or from living near contaminated grounds. Not much is know about Mirex’s effects on humans, particularly at low doses, but high-dose tests on animals revealed that it can cause “liver and kidney damage, and damage to the immune, reproductive, and nervous systems” and a probable carcinogen that can cause liver and kidney cancer, as well as leukemia (EPA, Mirex, 1992).

In the case of the Kepone site, the products were disposed of on-site through spray irrigation, storage in drums, and several earth and concrete lagoons,” pits or dugouts meant for waste treatment (EPA, Centre County Kepone; NRSC, 2016). According to Yoder, issues began to arise in 1960 as people began to complain of “chemical odor coming from Thornton Spring,” which discharged so many chemicals into Spring Creek that the fish there became unsafe for human consumption (Yoder, 2017; Carline, et. al., 2011). For reference, I have marked the locations named on the map below, along with their distance from Penn State. The disposal methods used resulted in the chemicals leaking into the groundwater and being transported around Centre County (EPA, Centre County Kepone).

Mirex sites

However, after decades of remediation and funding from the Rutgers Corporation, the site was deemed ready for “ready for reuse and redevelopment” by the EPA in September 2016 (Yoder, 2017). While the site was partially deleted from the National Priority List in 2004, it is expected to remain on the list until 2046 (Yoder, 2017).


Sources:

Biomonitoring Summary. (2017, April 7). Center for Disease Control and Prevention. https://www.cdc.gov/biomonitoring/Mirex_BiomonitoringSummary.html
Carline, R. F., Dunlap, R. L., Detar, J. E., & Hollender, B. A. (n.d.). The Fishery of Spring Creek. 88.
EPA Mirex Fact Sheet. (1992). United States Environmental Protection Agency.
Jim McClure. (1992). The Kepone-Mirex Problem [Drawing]. From Zettle, F. (1992). A Brief History of the Spring Creek Chapter of Trout Unlimited (Ed Bellis & Jim Strauss, Eds.).
Section VI: WASTE TREATMENT LAGOON (No.) Code 539. (2016). In Field Office Technical Guide. Natural Resources Conservation Service.
Superfund Site: CENTRE COUNTY KEPONE. (n.d.). Environmental Protection Acency. Retrieved March 26, 2021, from https://cumulis.epa.gov/supercpad/SiteProfiles/index.cfm?fuseaction=second.Cleanup&id=0300444#bkground
Yoder, S. (2017, November 1). After decades, portion of College Township Superfund site is safe for reuse. Centre County Gazette. https://www.statecollege.com/centre-county-gazette/after-decades-portion-of-college-township-superfund-site-is-safe-for-reuse/


Human Health Hazards (Dioxin) Blog – Ryan Coughlan

A recent article on Beyond Pesticides news website details the lasting effects that Agent Orange has had on Vietnam and the Vietnamese people.  The article explains that a dangerous toxin called dioxin, one of the “dirty dozen”, is a byproduct of Agent Orange.  Scientists at Iowa State and Illinois have discovered that 130,000 fifty-five gallon drums of toxic herbicides were sprayed over Vietnam during the Vietnam War.  A byproduct of this “Agent Orange” spraying is the dioxin TCDD, which has persisted for decades in Vietnamese water and soil.  According to researchers, the spraying of chemicals over Vietnam wasn’t limited to revealing enemy hiding positions.  Over 40% of the chemicals sprayed were over farmlands, mostly owned by citizens, not soldiers.Agent Orange Guide | Bosley & Bratch VA Disability Attorneys

Rain, erosion, and other factors have spread these chemicals, notably dioxin, into streams, rivers, and other wetlands.  Through biomagnification, dioxin has moved up the food chains of ecosystems and into fish that Vietnamese people consume and suffer harmful effects from like birth defects and crippling terminal diseases.  The researchers also explain that the only way to eliminate the dioxin contamination is through incineration, which is time consuming and extremely costly in Vietnam.

The primary source of dioxin in the environment stems from the industrial chlorination process, incineration of MSW, and certain herbicides.  It’s formed as a byproduct of many industrial processes, most commonly involving chlorine.  The most common form of human contact with dioxin comes from our diet.  93% of our dioxin intake comes from consuming meat and dairy products with traces of dioxin.  The dioxin bioaccumulates up the food chain so that the food we consume contains the problematic toxin.

Dioxin has the potential to cause cancer in humans and animals alike.  In 1997, the IARC announced that TCDD is a type 1 carcinogen, meaning that it is now a known human carcinogen.  Dioxin also has been known to cause birth defects, and interfere with hormone systems.  In this way, it acts as a sort of endocrine disruptor, causing potential pregnancy problems, reduced sperm counts, diabetes, and lung problems.

Works cited:

MedCrave Group. “Dioxins: Source, Origin and Toxicity Assessment.” Biodiversity International Journal, MedCrave Publishing, 6 July 2018, medcraveonline.com/BIJ/dioxins-source-origin-and-toxicity-assessment.html#:~:text=The%20major%20source%20of%20dioxin,also%20from%20backyard%20burn%2Dbarrels.&text=Dioxin%20is%20released%20by%20paper,factories%20and%20by%20all%20incinerators.

University of Illinois Studies. “Deadly Dioxin, An Agent Orange By-Product, Continues to Contaminate Vietnam.” Beyond Pesticides Daily News Blog, 12 Mar. 2019, beyondpesticides.org/dailynewsblog/2019/03/deadly-dioxin-an-agent-orange-by-product-continues-to-contaminate-vietnam/.


Earth 100H- ‘Human Health Hazards’ Freundt

DDT (dichloro-diphenyl-trichloroethane)

It was first developed as one of the modern synthetic insecticides in the 1940s. It was first used to fight off malaria, typhus, and other insect-borne human diseases. It was also used for insect control in crops and livestock production, home gardens, etc. However because DDT was used so much, many insect species became resistant to it. Due to its declining benefits and research pointing at its environmental and toxicological negative effects, in the 1960s the EPA began to prohibit its use. Research conducted then and since then has pointed a link in between DDT exposure and human reproductive effects. In a study conducted with animals it showed that animals who were exposed to DDT developed liver tumor. Because of these studies, the U.S and international authorities have now placed DD under the classification of probable human carcinogen. Since then, as of 2006 the world health organization and the EPA have been participating in international negotiations to control the use of DDT. DDT is now only recommended by the WHO for interior spray use, such as they used in African countries to fight off malaria.

https://www.epa.gov/ingredients-used-pesticide-products/ddt-brief-history-and-status

Human Health Hazards- Katelyn Forman

Katelyn Forman- DDT

The pollutant that I chose to look into was DDT; however, my article also touches upon the chemical chlordane as well. DDT is an insecticide that was used to attack certain diseases and protect against insects. Due to its negative effect on wildlife, affecting the nervous system, and classification as a possible carcinogen, DDT is no longer used. Almost a year ago this article was written in response to the discovery of these pesticides in 60% of black women in Detroit.

These women were infected by these chemicals because DDT and chlordane can stay in the environment even decades after being used. There is a correlation between minority populations and pesticide contamination which is why this discovery is not completely surprising. After testing the blood of black women in Detroit it was confirmed that over 60% of the participants had significant levels of OCPs in their blood samples. Interestingly, the study also found that of these participants “women who drink five glasses of tap or bottled water per day have 8-15% higher concentrations of all four OCPs” (Beyond Pesticides, 2020). This revelation is one of the reasons why drinking water was investigated for pesticide contamination. Furthermore, the interference of DDT in black women’s bodies also affect their children if they are mothers that breastfeed. In fact, these chemicals were 15% higher in these breastfed infants than in non-breastfed infants.

One of the key points of the article is that the EPA did not monitor these chemicals which is why these women were ultimately exposed. Although DDT was not being currently used, it was still prominent in the environment and has been passed down now to children. Similarly, researchers found that older women had higher concentrations of the OCPs in their systems. This clearly shows that the chemical has been been slowly infecting the community/area over a long duration of time. Despite its containment in POC areas, there was contamination in alcohol and tobacco as well, so people from outside residential areas could also be affected by these pollutants.

The exposure to these hazardous chemicals includes a risk of diabetes, reduced sperm, endometriosis, obesity, and early onset menopause. Additionally, DDT poses a threat to our ecosystems because it effects wildlife. DDT’s impact on wildlife comes from its toxicity to marine life as well as its harmful impact on bird reproduction by making eggs have a softer shell, thus easier to crack.

Sources:

DDT metabolite (DDE) and other Banned pesticides found in blood sample of African American women in Detroit. (2020, May 14). Retrieved March 26, 2021, from https://beyondpesticides.org/dailynewsblog/2020/05/ddt-metabolite-dde-and-other-banned-pesticides-found-in-blood-sample-of-african-american-women-in-detroit/

Ddt – a brief history and status. (2021, March 17). Retrieved March 26, 2021, from https://www.epa.gov/ingredients-used-pesticide-products/ddt-brief-history-and-status

Author: William Anderson (Schoolworkhelper Editorial Team) https://schoolworkhelper.net/ Tutor and Freelance Writer. Science Teacher and Lover of Essays. Article last reviewed: 2020 | St. Rosemary Institution © 2010-2021 | Creative Commons 4.0, Author:, & Tutor and Freelance Writer. Science Teacher and Lover of Essays. Article last reviewed: 2020 | St. Rosemary Institution © 2010-2021 | Creative Commons 4.0. (n.d.). Ddt: Environmental impact, dangers, history. Retrieved March 26, 2021, from https://schoolworkhelper.net/ddt-environmental-impact-dangers-history/#:~:text=DDT%20has%20had%20a%20huge,interferes%20with%20certain%20reproductive%20enzymes.

‘Human Health Hazards’ blog entry Matthew Soska

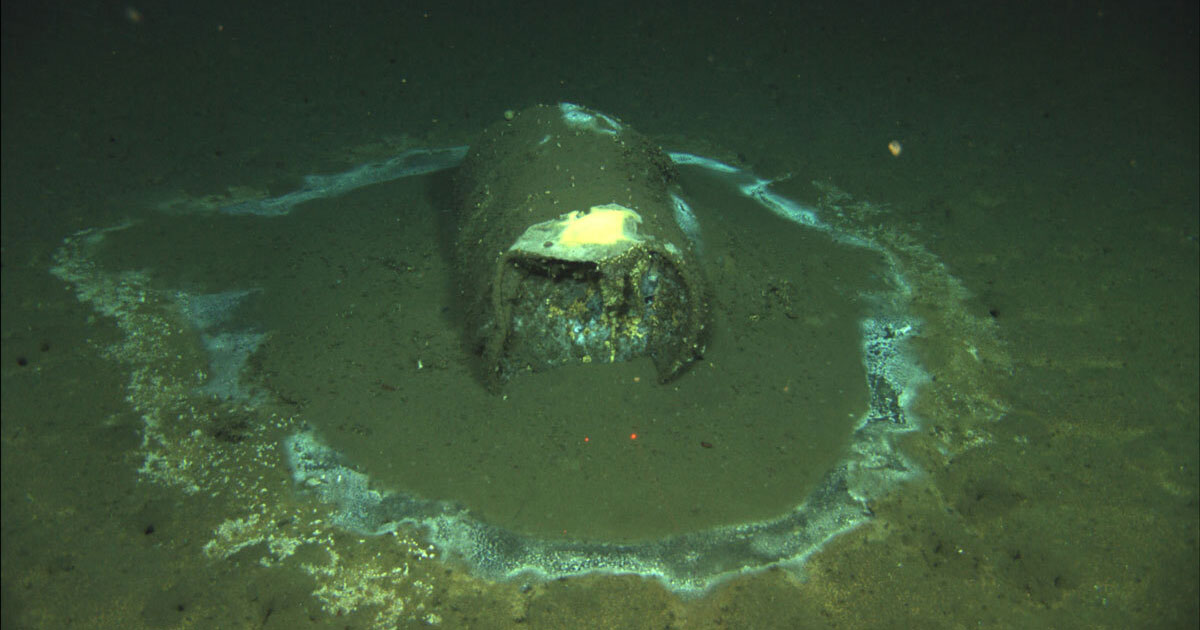
Molly Taft wrote an article about how “Underwater Roombas” are cleaning up DDT that is seeping out of old barrels dumped in the pacific. A large manufacturer of DDT had been dumping the barrels for years and in 2000, after a lawsuit was filed, they found the rumours to be true (Taft, 2021). Starting with Rachel Carson’s Silent Spring in 1962, there was a huge outcry to ban DDT which was successful in the mid-1970s. 

The reason DDT was banned is because of bioaccumulation. It starts in the water and makes its way up the food chain. Also, it can be found in the environment for 2 to 15 years at least (Taft, 2021). After that it breaks into DDE or DDD. This has negative consequences for both humans and animals. One of the effects DDT has is it deprives birds of calcium. This has been the reason egg shells have thinned down and thus harming bird populations. Finally, it can kill aquatic invertebrate species. Examples are: stoneflies and crayfish. 

An accumulation of around half a million barrels has devastated Catalina Island sea life. Scientists have sent down robots equipped with sonar radar to assess the damage these barrels have caused. They’re on a 12-16 week mission to gather data from the biosphere in order to better assess possible solutions. 

Although DDT was banned in the 70’s, it’s still in the environment today. It was developed during the 1940s to help both the military and civilians fight insects that carried diseases like malaria and typhus (EPA, 2021). Moreover, it helped protect crops and gardens from insects as well (EPA, 2021). Its success in its intended purpose caused it to be used widespread in the United States. This overuse is the reason it’s still in the environment today even though its illegal. DDT is not naturally occuring so all of it in our ecosystem is because of human use. It comes from people spraying it and companies disposing of it (as noted in Taft’s article). 

There is no link between low doses of DDT and adverse health effects in humans (CDC 2017). DDT in high doses, however, can cause vomiting, tremors, and shakiness (CDC, 2017). DDT is a possible human carcinogen (CDC, 2017). Most people are exposed through eating food and touching contaminated surfaces. Because it’s so wide-spread, DDT has been found in infants from their mothers and even breast milk. 

Sources 


  1. Taft, Molly(2021).‘’Underwater Roombas’ Help Start Cleanup of Decades-Old Toxic Waste Dump Along California Coast”. Retrieved from: https://earther.gizmodo.com/underwater-roombas-help-start-cleanup-of-decades-old-to-1846457859 
  2. EPA(2021).‘DDT – A Brief History and Status”. Retrieved from: https://www.epa.gov/ingredients-used-pesticide-products/ddt-brief-history-and-status
  3. CDC(2017). “Dichlorodiphenyltrichloroethane (DDT) Factsheet”. Retrieved from: https://www.cdc.gov/biomonitoring/DDT_FactSheet.html