Blog Post 8
Dear Blog,
Today I read a very informative article about adding visuals to a report. I often forget to consider adding visuals to my writing, and when I do I often am not sure how to add them. This article gave me a lot of good advice that I would like to share with you.
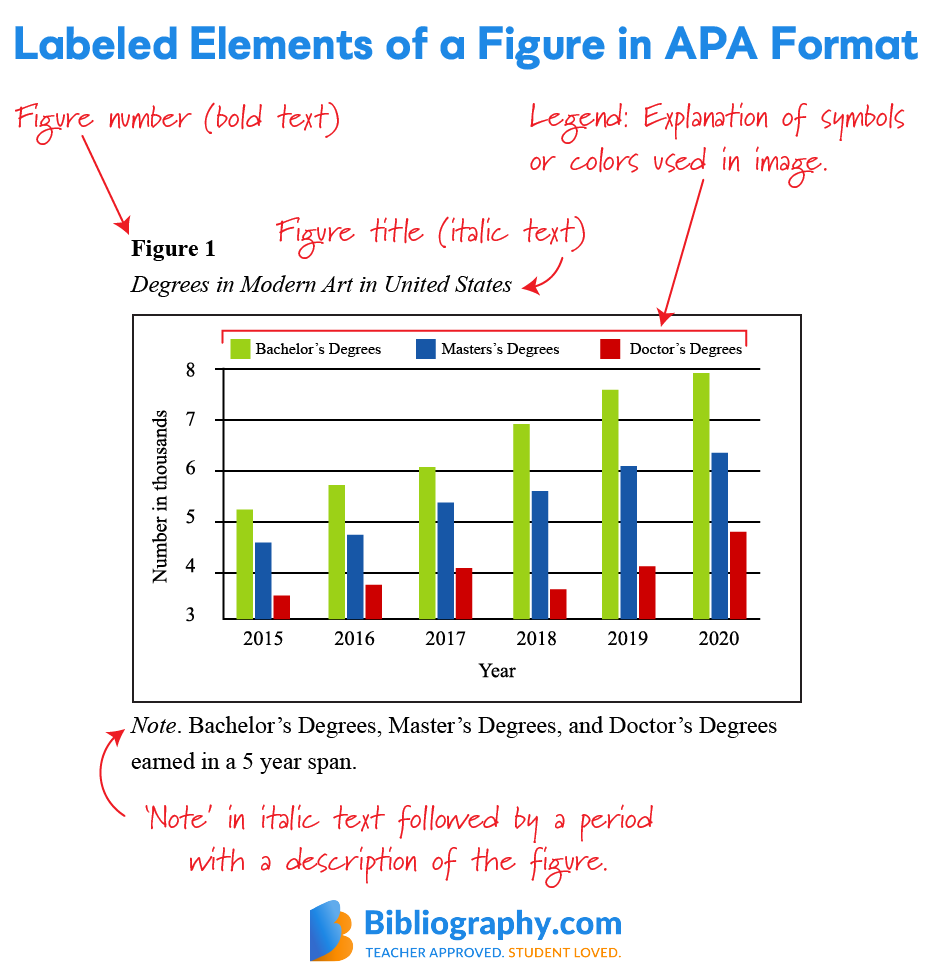
The first piece of advice was to label, number, and title my graphics. This one is something I often forget to do, but it is common practice to make sure your graphics make sense. This picture gives a visual example of how to label a graphic in APA format:
I found a picture that also describes how to properly label and place information on a line graph so it is clear and easy to read:

Their next piece of advice is to place the graphic in the right spot. I often struggle to decide where to put a specific graphic, but good placement is definitely important to make sure it is relevant to the current topic. It is also important to keep the overall layout looking clean and easy to navigate.
The next piece of advice was to explain each graphic. This is actually something I do very often. I think explaining the relevance of your graphics is important for them to have any actual meaning. We are also told to explain where each graphic comes from unless we make it ourselves. This one is important because if you do not explain where it originates from, it could be considered plagiarism. Explaining the source could also inform readers about any potential bias or misinformation the graphic could have. This article explains more about how to properly cite your graphics:
We are also told to make our graphics stand out. I often do not look to hard at graphics myself unless they seem interesting to me. If your graphic has important information that you want your reader to see, it is important to make sure they read it by peaking their interest enough for them to pay attention to it. This article talks a little more about considering your audience and their interest:
The last advice I was given is to make my graphics easy to find. Sometimes it Is easy to miss graphics when they are hidden away on the side of the page or in the bottom corner. I often put my graphics right below the paragraph that explains them, so the reader sees them right after they read the context behind the graphic. This last article gives several more tips about how to use graphics and which ones to use depending on the information: https://pressbooks.bccampus.ca/communicating/chapter/chapter-31/