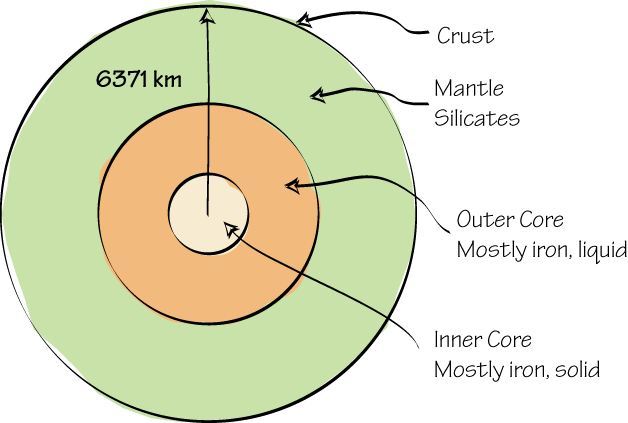
Cross section of Earth showing the major chemical divisions in the planetary system.
We discussed Earth’s interior and in particular its major compositional regions (atmosphere, crust, mantle, core).
(10 Sep) Students completed an in-class activity related to inferences regarding the composition of Earth’s Core.

Plate boundary summary cartoon.
I continued on from the discussion of Earth’s Interior to Plate tectonics. I presented some simple maps showing the current plate boundary locations and discussed some of the history of plate tectonic ideas.
(12 Sep) Students completed an in-class activity using data from the southern-Atlantic sea floor to test the idea of sea-floor spreading using ocean sediment age measurements across the Mid Atlantic Ridge. Students completed the in-class activity on the plate motion in the southern Atlantic Ocean. Most found a speed of 20 mm/yr for the motion of a location on one side of the boundary relative to the ridge (25 mm is about one inch). Since spreading occurs in both directions, the Atlantic Ocean Floor in this region is increasing by about 40 mm/yr.
I finished the class showing some plate-motion history and with a tour of Earth’s surface features, which are strongly influenced by plate motion and interaction.
Plate tectonics is the primary way Earth’s Interior cools. The energy transfer associated with the process reshapes the surface and produces much of the geology we observe, including volcanic activity and earthquakes.
(17 Sep) Students completed an in-class activity using the age of Hawaiian volcanic rocks to estimate the relative speed of the Pacific Plate to the underlying Hawaiian Hot Spot. The number of keep in mind is cm/yr or 10’s of mm/yr.