Many important decisions are grounded on statistical analysis. For example, statistical data of clinical trial plays a critical role in approving new drugs. Statistical analysis is also widely used in educational research to assess student learning outcomes, and the results of such analysis can have broad impact in teacher training, allocation of educational resources, and college admission. Because of the important role statistics plays in validating research findings and guiding policy decisions, Vardeman and Morris (2003) point out that integrity and ethical principles are vital for the profession of statistics. In their article “Statistics and Ethics: Some Advice for Young Statisticians,” Vardeman and Morris (2003) underscore the importance of being impartial for statisticans: “a professional statistician should never behave like a courtroom lawyer…[as the latter] involve the selective use of evidence so as to present the truth (or some part of it) in the light most favorable to a particular point of view.” According to Vardeman and Morris, statisticians should not use evidence selectively to advance a particular agenda, and in cases where the statistician cannot avoid taking sides, they have to “keep absolutely clear the distinction between an objective analyst and an advocate, and never purport to be (or think yourself) the first when you are the second.”
In addition to impartiality, Vardeman and Morris (2003) also urge statisticians to recognize the assumptions undergirding their work and to acknowledge the limitations of statistical analysis. To effectively address statisticians’ underlying assumptions and the limitations of their analysis, Vardeman and Morris (2003) recommend transparency: “Statisticians must write complete reports stating the results of their entire informed thought processes—including what they know, what they have assumed, what they have decided cannot be assumed, and what conclusions tenable assumptions support.” This quote shows that transparency is not only an ethical value but also an epistemic norm in the statistics community; that is, maintaining transparency requires not only ethical commitment but also good habits of conducting statistical analysis. Such instructions for transparent statistical analysis, you might notice, resemble what we recommend in lab note taking; namely, one should document not only the results but also the procedures and conditions in which data is acquired, In both cases, comprehensive documentation enhances the reproducibility of the experiments and the analysis.
In order to effectively and ethically use statistical analysis for processing, summarizing, and understanding data, researchers should investment themselves in learning the basic concepts and methods of statistics. Members of the Penn State community have free access to an online course, PSU STAT 500. The course introduces commonly used statistical concepts and the fundamentals of quantitative data analysis through instructional videos, texts, and sample problems. This course provides a great start for graduate students and new researchers who want to develop a basic understanding about statistical analysis in the research process.
For more complex research projects that involve sophisticated data sets, it is common for a research group to hire professional statisticians for data analysis. In this case, researchers who have designed the study and collected the raw data should collaborate closely with the statisticians, who have expertise in analyzing data and interpreting its significance. Effective communication between the researchers and the statisticians is a key in this collaboration. To the extent that is feasible, members of the research team, and in particular, co-authors of the final publications, should try to understand the statistical analysis, such as how the data supports or refutes certain conclusions.
Although statistics has provided sophisticated and powerful tools for understanding data, it is necessary, as Vardeman and Morris suggest, to reflect on the underlying assumptions of its methods and to be mindful of its limitations. Historically, statistics has not always been an impartial and transparent profession. Instead, the birth of statistics was driven by nothing but particular interests and partial purposes. Whereas statistics today is widely considered an important tool for evidence-based research, philosopher of science Ian Hacking (1975) reminds us that the concept “evidence” itself meant very differently from our contemporary understanding in the 17th century, when probability theory was being developed. Also, historian Theodore Porter’s (1986) study of the emergence of statistical thinking in the 19th century Europe suggests that statistics first gained attraction not as a mathematical discipline but as a “numerical social science,” a study of various “status” of society, such as crime, death, and marriage. Porter (1986) argues that statistics prior to the 1890s was advanced primarily by a number of social and political thinkers who were interested not in objective data analysis but in advancing their religious and political agendas.
Evidence and Statistical Thinking in History
Unlike its contemporary meaning, which is closely associated with observation, experimentation, and objective proofs, the word “evidence” prior to the 17th century meant primarily testimonies given by people with authority. Accordingly, copying or citing the words of “wise people” was the most popular form of evidence at the time. Hacking (1975) notices that the notion of evidence as testimony by people with authority changed in the 17th century, when people started to distinguish external evidence (words from wise people) from internal evidence (facts and signs of nature). Hacking (1975) attributes the concept of internal evidence to intellectual efforts which at the time were considered “the low sciences, alchemy, geology, astrology, and in particular medicine” (p. 35). Students of the “low sciences,” such as physicians, suggested that the testimony of God—the ultimate authority—was revealed in nature, and therefore, signs of nature provided more authoritative evidence than the words of any wise people. As the signs of nature did not always reveal themselves the same way, people used the frequency of their appearance—or their probability—to measure the quality of evidence (Hacking, 1975).
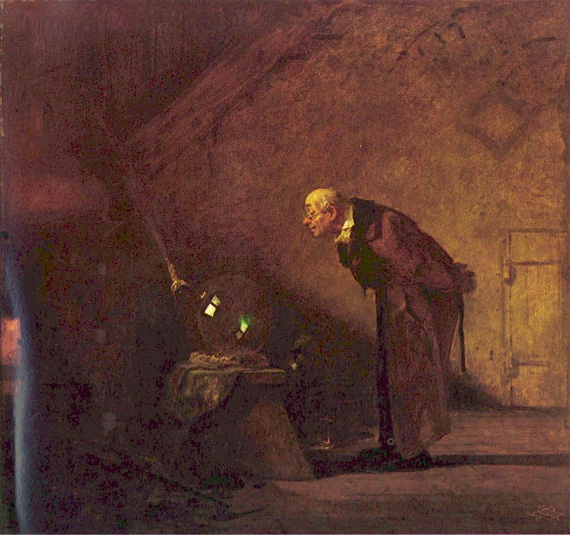
Figure 2 Practitioner of One of the “Low Sciences”—Alchemy. (Carl Spitzweg / Public Domain)
The meaning of “statistics” also underwent significant changes during the past few centuries. Statistics prior to the 19th century referred to a loose range of studies that were concerned with “states and conditions” (Porter 1986, p. 11). In the 19th century, statistics was considered as an “empirical, usually quantitative, social science” (p.11), and it did not become a field of applied math until the 20th century (Porter 1986). According to Porter, collecting data about society in the 19th century was driven by political thinkers who abandoned a static view and came to see society as a dynamic and evolving system. Under this background, statistics emerged as a tool for improving the efficiency of government. Instead of being a neutral and value free method, statistics in the 19th century functioned as a “political technique” for advancing the agenda of a selective politicians (Porter 1986).
Today, statistical thinking is driving a paradigm shift in how we understand and create new knowledge. As Mayer-Schönberger and Cukier (2013) suggests in their book Big Data, A Revolution That Will Transform How We Live, Work, and Think, big data has shifted the focus of our inquiries from “causality” to “correlation.” According to these authors, the enormous capacity of big data analytics has enabled us to find patterns of correlation between data sets without understanding why they are correlated. For example, Mayer-Schönberger and Cukier (2013) write, a customer can use big data analytics to find out when the price for a flight will drop, and there is not need for her to understand why the price changes. Admittedly, the shift from “causality” to “correlation” can significantly facilitate discovery in many research fields (e.g., in cancer diagnosis). Meanwhile, we ought to be cautious about the limitations and unintended consequences of correlation-based decisions, for things in real life are sometimes related in ways that are too sophisticated for a statistics-based algorithm or analytics to grasp. A friend of mine once complained that her Internet browser was filled with laundry detergent ads after she had purchased a gallon from an online store. “Why do they think I need more laundry detergent when I have just filled a year’s supply?” Her comment illustrates the absurdity of dogmatically following probability and similarity based thinking, which assumes that consumers who have purchased one product are more likely to be interested in similar products. The negative impact of statistics based algorithms can be far more severe than embarrassment, even in cases when the algorithm accurately identifies the correlation. For example, many news websites today recommend news to readers based on their browsing history (often under the “you might like” tab). While this feature might accurately predict and meet the readers’ interests, it inadvertently discourages the public from reading broadly and engaging perspectives that are different from their own. In the long run, then, these algorithms that recommend stories might work against an open-minded public and compromise the diversity of our society.
Next Page: Previous Page: