Pad to Palm: What is Behind Your Prescription?

Fig 1. Opioid Prescribing is Still High and Varies from County to County. Centers for Disease Control and Prevention.

As a pharmacy technician in a college town, it is not uncommon that I get students in the pharmacy who don’t know how the industry works. Whether we’re still waiting on an authorization from their primary care provider, there is a conflict with their insurance, or even if they have just run out of refills on a prescription, there is often an awkward admittance that they, consumers, do not fully understand what it takes to get a prescription in their hands. Despite this being an embarrassing confession for some, they’re certainly not alone. Before I entered the industry, I had little to no idea of what went on behind the scenes and, honestly, I still learn a lot every day. Healthcare is an extremely complex field to navigate but understanding your role in it is paramount. In today’s post, we’ll be looking at the journey a prescription takes after being written by your physician, to landing in your hand at the pharmacy.

The first step that must occur is the writing of a prescription. Under the DEA and Controlled Substances Act (CSA), drugs are classified using schedules. Each schedule categorizes drugs based on how addictive they are and their potential for abuse. Schedule I drugs include big names such as LSD, Heroin, or Quaaludes. These drugs have no therapeutic value and are highly addictive substances. The severity of regulation and risk-of-abuse drops as the schedules rise. Most Schedule V drugs can be purchased over the counter. When a physician writes a prescription, he or she must take into account what schedule your ailment or need calls for. The script is then written for the patient, specifying: the quantity prescribed, the number of refills available, whether or not generic drug substitutions are approved. While physical scripts can still be written at the convenience of the patient, many states and health systems are phasing them out in lieu of digital scripts. Digital scripts are sent directly to a pharmacy of the patient’s choosing and processed accordingly from there.

Fig 2. Drug Representative. Mado.

Often, a physician’s choice of drug can be influenced by pharmaceutical companies pushing new products. The research and development department of pharma companies develop new drugs to be approved by the FDA and pharmaceutical representatives then advise doctors on them. Drug prices are negotiated between these pharmaceutical companies and insurance companies or pharmacy benefits managers (PBMs). What these companies intend to do is to lower prices through rebates and discounts. Once these are negotiated, the drug is added to the company’s formulary or coverage and patients with that insurance plan are able to get it for lower than the developer’s “wholesale price”.

Pharmacies, who order these drugs, need to process you as a patient and insurance beneficiary upon receiving your prescription. Pharmacies look at and input your insurance coverage into their system and draw up the script through that. If your prescription is covered under your insurance, you will most likely be able to pay a reduced fee through a copay or coinsurance. Nerdwallet.com explains the differences between the two like this, “You pay a monthly premium just to have health insurance. When you go to the doctor or the hospital, you pay either full cost for the services, or copays as outlined in your policy. Once the total amount you pay for services, not including copays, adds up to your deductible amount in a year, your insurer starts paying a larger chunk of your medical bills, typically 60% to 90%. The remaining percentage that you pay is called coinsurance”. Cost-sharing methods like these are the reason you typically pay only a fraction of the drug’s true cost.

Fig 3. Illinois PBM Pharmacy Audits Defense Lawyer. The Law Offices of Joseph J. Bogdan, LLC.

However, these reduced costs are also the reason many are left shocked when something is not covered and an issue in payment arises. It is not unusual for a student to be checking out and we find their prescription was not covered by insurance. This can happen for a number of reasons and can either be solved by you or the pharmacy staff. Two common reasons for denial of coverage are: a request for prior authorization and the prescription is being filled too early. A request for prior authorization is fairly simple. When a drug’s medical necessity is drawn into question or it is not covered under their formulary, insurers will request a prior authorization before covering it. If this is requested, you may call your physician to be switched to another drug or appeal the request for approval. The pharmacy may also call on your behalf. Another very common thing in the college demographic is patients attempting to pick up prescriptions earlier than what is covered by their insurance. While the pharmacy can begin to refill a prescription, they will not be able to complete the process if it is being filled too soon. Insurers do not want to cover any unnecessary payments if the patient still theoretically has enough of a drug left from their last fill. This denial may also arise if the drug is a more heavily monitored, controlled substance or narcotic. Schedule II and III drugs are very strictly controlled. Many cannot be refilled, and those that can must be without overlap to prevent any ease of abuse.

Healthcare is one of the most consumer-centric industries and yet, one of the most confusing to navigate as a consumer. The irony of this is blatant. Like in anything though, it is important to start off on a good foot and digest a little material at a time. It is my hope that after reading this article, you will have a greater understanding of what happens between seeing your doctor and picking up your prescription.  

Understanding Medicaid

Fig 1. Alabama Senate to Bentley: Do not expand Medicaid under any scenario. Yellow Hammer.

In politics today, Medicaid is a frequently discussed legislative topic. That being said, many are unaware of how it works or what it means to be enrolled in the program. With millions of beneficiaries covered under Medicaid in the United States, it’s important to have at least a general grasp of it. In this post, we will be covering the history of Medicaid, differences in state implementations, and the future of the program with consideration of legislative change. I hope this furthers your knowledge and curiosity of the federal and state run program and compels you to think about how it affects you.

According to Medicaid.gov, “Medicaid is a joint federal and state program that, together with the Children’s Health Insurance Program, provides health coverage to…. Children, pregnant women, parents, seniors, and individuals with disabilities”. Medicaid was signed into law in 1965, having been authorized by Title XIX of the Social Security Act. Medicaid came about due to a varying scope of covered healthcare services across states. For low-income individuals and families, there was great disparity across the board, depending upon where you lived. This program came about with the intention of expanding access to healthcare for these populations. To do so, the federal government would pay for half or more of state costs in providing services to those enrolled. Participating states were required to have a basic set of health services for those benefiting, in order to receive federal funding. Currently, all states, territories and the District of Columbia participate in and have Medicaid programs.

Fig 2. Medicaid’s Role for Medicare Beneficiaries. Kaiser Family Foundation.

Outside of the necessary parameters established federally, every state runs their individual Medicaid program differently. State programs typically differ in the amount federal funds are matched, required eligibility, healthcare delivery, and what services are provided. In terms of eligibility, there are certain federal guidelines that are met across the states. In order to participate, states are mandated to cover groups such as: low income families, qualified pregnant women and children, and those receiving Supplemental Security Income (SSI). With 2010’s Patient Protection and Affordable Care Act (ACA), the option to open eligibility to those at or below 133% of the federal poverty level (FPL) became available for many states. While most states do participate in offering this expanded coverage, there are those that do not. Outside of the expanded coverage, eligibility is discerned by financial and non-financial factors. Financially, income eligibility is assessed using Modified Adjusted Gross Income (MAGI). This methodology looks at taxable income and tax filing relationships. While some are assessed outside of this system if they have blindness, a disability, or are over the age of 65, this is used for most demographics and was used to standardize the enrollment process for other programs, such as Medicare and the Children’s Health Insurance Program (CHIP). Non-financial eligibilities consist of whether or not you are a resident of a particular state or the country, as well as age limitations or pregnancy/parenting status. States also have the ability to implement “medically needy” programs. These cover individuals whose incomes are above the FPL % required by the state but have substantial health needs. Qualification for such programs is based on how much is down spent on healthcare services not covered by health insurance. Spending down on these costs must cover the difference between an individual’s MAGI and the state’s income requirement.

Fig 3. How Deep do the Medicaid Cuts Go in Republican Health Plan?. Healthline.

The future of Medicaid is a hot topic now. With a GOP controlled executive and Congress, a lot of sway lays in the hands of the Republican party. In 2017, there was an attempt to repeal and replace the Affordable Care Act and convert Medicaid to a per capita cap financed system through the use of a block grant. This would have fixed federal funding of Medicaid in states and deterred further uptake of the program and state involvement. The Trump administration has also expressed the intent to allow states to use waiver authority in order to adjust Medicaid. With this, the federal government would enable states to impose more selective measures in the application process. These measures may include: work requirements, drug screening and testing, eligibility time limits, and premiums with disenrollment for non-payment. It will be interesting to see how this play out, if allowed, and how Democrats will combat these efforts.

A knowledge of government programs is extremely important. Medicaid affects us all on a state and federal level and incoming changes are especially important to pay attention to. I hope, at least in a general sense, that you feel you are all better informed in the matter do to this blog. While I certainly did not dive into great depths, considering minutia that makes up government policy, this is a great jumping off point to do some research of your own and develop a personal understanding of what these changes might mean to you or those you know.

The Opioid Epidemic

Fig 1. CNN. America’s Opioid Epidemic.

Drug overdose is the leading cause of accidental death in the United States. In 2015 alone, there were 52,303 lethal drug overdoses. As the American Society of Addiction Medicine (ASAM) points out, opioid addiction is the leading cause of this epidemic. The ASAM is quick to highlight the over-20,000 overdoses related to prescription pain relievers in 2015, as well as the nearly 13,000 heroin related deaths in the same year. America’s opioid epidemic is a huge problem that we should all be well aware of. Opioid prescriptions are fairly easy to come by. I can say that I have heard first hand of people selling extra pain killers following common procedures in the youth demographic, such as wisdom teeth removal or ACL reconstruction. It is stated that most opioid addicts are introduced to the drugs through the gifting of family members and friends. The fact that teens, and Americans as a whole, aren’t aware of the severity of this epidemic and the ease of developing an addiction to opioids, is highly concerning.

Fig 2. New York Times. The Opioid Epidemic: A Crisis Years in the Making.

The opioid epidemic has been a problem of mounting degree over the past decade. Above is an image created by the New York Times to illustrate the growth in the number of overdoses across the US. As you may see, the scope and density of overdoses have increased dramatically since 1999 to 2014. In 2016, the government produced the first national data to break down this rise by drug and state. The account of drug deaths showed that deaths by the use of synthetic opioids, primarily fentanyls, had gone up 540 percent in only 3 years. Though President Trump claimed to bring this problem to the level of national emergency, he has only deemed it a public health emergency thus far. No additional federal funding has been put towards deterring this epidemic.

Fig 3. Board Vitals. Are Doctors Addicted to Prescribing Opioids?.

In terms of enabling the spread of this problem, the healthcare industry needs to shoulder a large part of the blame. While the New York Times points out that pharmaceutical companies and physicians have been catching most of the flak, it also calls out insurers for their hand in the matter. The problem lies with insurers restricting more expensive, but less addictive painkillers. These alternatives to addictive painkillers such as morphine and oxycodone are safer, but come at a greater cost to insurance companies. Insurers, in conjunction with pharmacy benefit managers who coordinate drug plans, are coming into the spotlight more though now. The New York State attorney general’s office, as of 2017, reached out to CVS Caremark, Express Scripts, and OptumRx (3 of the largest pharmacy benefit managers) to inquire about how they were looking to curb the issue. Hopefully, this pressure will force action and results toward solving the problem. Currently though, the state of the situation is dire. While it is easy to obtain highly addictive opioids, it is still incredibly hard to get the drugs prescribed for treatment against addictive substances. Behind what seems to be an easy conspiracy is solely the desire for cost-savings and a reduced hit to Big Pharma and the insurance companies’ expenses per patient. What this accomplishes in the medical community is the incentivization of cheap and fast treatments. Despite the immediate gratification, these have no shortage of consequences, as seen in the overdose death toll.

Another, lesser known, problem is the proliferation of hepatitis C in young America because of the epidemic. Those injecting themselves with opioids and sharing needles are causing a rapid spread of the disease. According to a post on Reuters, the number of hepatitis C infections has almost tripled from 2010 to 2015. This has caused the under 30 population to now be the most at-risk for contracting and transmitting hepatitis C. This virus kills nearly 20,000 Americans every year—that figure is more than HIV and all other infectious diseases combined. Hepatitis C results in cirrhosis of the liver and, eventually, liver cancer or liver failure. With such a large associated death rate tied to the opioid epidemic, the price tag only gets bigger for what it’s costing our country’s welfare.

Fig 4. Spine Health. Narcotic Pain Medication.

Not enough people are aware of how severe the opioid epidemic is. While the legalization and popularization of marijuana in many states has affirmed for many that one form of drug consumption is safe, a large crackdown on drug culture is still necessary in America. Having heard personal accounts of young Americans contributing to the normalization and spread of prescription painkillers, I fear the outcomes in my generation if we don’t work to stop this crisis. I think there is a direct tie to a more laissez-faire attitude on drugs as of late, regardless of one’s view on marijuana and its legalization. Prescription painkillers are true gateway drugs to the other names of the opioid epidemic, such as heroin, and their overprescribing and high addiction rates should be better known.

The Physician Shortage

Fig 1. Heroic Stories. The Amazing Doctor.

With all the hang-ups in administering care to the public, one of the biggest setbacks might be the fact that we simply don’t have enough physicians.  With the years of training required to enter the field of medicine and a growing price tag that comes along with the education needed, less people are pursuing the long-honored profession. This is a problem especially when looking back at some of the past articles we’ve read in Hall on Health. With unhealthiness trending in the forms of rising obesity rates, hospital-associated infections still tallying large numbers in deaths, an ever-growing aging population of Baby Boomers, and with millions of new beneficiaries under the Affordable Care Act, we need physicians now more than ever.

“The cost is too great, and it’s a lousy job,” said Regnal Jones, executive director of the Chicago Area Health and Medical Careers Program. “The minute you say to me that you want to be a physician, it’s tantamount to saying you want to be an indentured servant.”

Jones was fielding questions from Dawn Trice, a Chicago Tribune reporter. In 2013, Trice took to speak with Jones upon hearing word of his then-unorthodox advice. For years Jones had preached and encouraged the medical school route to his students from underrepresented racial and socioeconomic groups. Having helped nearly 5,000 students at the time of the interview, Jones had helped many along the way to medical school admittance. However, over time his view of that decision had changed.

Fig 2. New York Times Blogs. Should Medical School Last Just 3 Years?.

Many have begun to think this way as well, and for the same reasons. Jones goes on in the article to highlight the years of commitment required through schooling, the nearly insurmountable debt that accompanies it, and the grueling hours required during lengthy residencies that only net you as little as $40,000 a year.

For these reasons, many would-be physicians are turning to the physician assistant track. Physician assistants, or PAs, are growing in demand—both by health care systems who see them as cheap alternatives to physicians and future health professionals. The allure of the position lies in the time commitment to training, the liberties of the position, and the opening salaries.

To become a physician assistant, significantly less time is required when compared to the schooling a physician must do. Following your undergraduate years and a entry exam, students typically complete an accredited Physician Assistant program, which is usually only a 25 month process. While this is 2 years, it is still only half that of a med school program. Once this program is completed, PAs must successfully finish a year-long clinical rotation, giving them experience in the field. From there, they are free to practice as fully trained physician assistants (with the caveat of regular re-testing and continued education throughout their career).

Fig 3. Hartford Courant. Quinnipiac Physician Assistant Students Volunteer Time, Skills As Urban Health Scholars.

The liberties of the profession are fairly numerous. While a PA operates beneath a physician’s supervision, they are able to perform many of the same duties: examinations, diagnostics, developing treatment plans, counseling patients, and—in some states—writing prescriptions.

Compared to the entry-level salary of doctors at $40,000, a PA’s average salary out the gate falls around $90,000. This stark contrast is something that entices many to the position. While there is a about a $100,000 disparity between the average salaries of the two positions ($201k for physicians vs. $102k for PAs), many argue that the time spent in the workforce before physicians are fully practicing makes up for it. With less schooling debt and not as much need for heavy malpractice insurance due to lower liability, the salary of a physician assistant comes with less catches.

For this reason and many others, there is a growing shortage of doctors in the United States. The Association of American Medical Colleges (AAMC) calculates that the United States will have a shortage of between 40,800 and 104,900 physicians by the year 2030. The study run by the AAMC uncovered that the numbers of new primary care physicians and medical specialists aren’t tracking with the increasing volume of the growing and aging US population. Like mentioned before, the study also calls on America’s growing aging population as the primary stressor and concern. The article published calls to attention that by 2030 the 65 and older population is expected to increase by 55% and the 75 and older population by 73%. The CEO and President of the AAMC, Darrel G. Kirch, MD is quoted saying, “This makes the projected shortage especially troubling, since as patients get older they need two to three times as many services, mostly in specialty care, which is where the shortages are particularly severe”.

Fig 4. Medical Recruiting. Part- Time Physician | Post Injury Care| Salt Lake City, UT.

This is an issue that is perhaps greater than any covered before in these posts. Without physicians, we will be hard-pressed to even treat anything you’ve read here. The AAMC advocates a multifaceted solution that covers healthcare delivery innovations, team-based and coordinated care, and a better use of technology. The association is also pushing hard for increased federal support of residency positions in the US. It states that, while many medical schools have expanded their class sizes, there are still not enough openings in graduate medical education. By proposing an additional 3,000 spots in residency over a 5-year span, more doctors will be practicing in the field and lending their services to people and the country.

HAIs

Fig 1. The New York Times. Bad Hospital Design Is Making Us Sicker.

Nosocomial infections, healthcare-associated infections, hospital-acquired infections… there are a number of buzzwords and shifting terms to describe what is a grave epidemic in the United States. Though these are often preventable cases, the fact of the matter is that, what we will call healthcare-associated infections of HAIs, are a major problem in the delivery of care and a patient’s wellbeing.

According to the Center for Disease Control, about 1 in 25 hospital patients has at least one healthcare-associated infection a day. The CDC collects data on HAIs via the National Healthcare Safety Network (NHSN) and the Emerging Infections Program Healthcare-Associated Infections Community Interface (EIP HAIC). This is an important metric in understanding healthcare and the systems that make it up. Using the data collected, the CDC pushes out yearly reports for states to see their progress and their areas that need improvement. According to the National Institutes of Health, HAIs have become increasingly common in medical care as the field and its patients have grown more complex. Without implementing comprehensive programs to curb disease outbreak and promote infection-prevention practices, it will only get worse. The CDC reports that HAIs affect 5 to 10 percent of US hospital patients per year. Roughly 1.7 million of these infections occur on a yearly basis and result in 99,000 deaths in the US alone. HAIs incur an estimated $20 billion in healthcare costs every year.

Fig 2. Huffington Post. Do You Know Who Used Your Hospital Bed Before You?.

A healthcare-associated infection is one that is caught while hospitalized. The medical term, nosocomial infection, comes from two Greek words, “nosus” meaning disease and “komeion” meaning to “to take care of”. The sad irony of a disease contracted while under medical care is highlighted by what is practically an oxymoron.

The history of the nosocomial infection began in the early 1700’s. Before that time, cross-infection due to unsanitary practices in the medical field were unknown and unheard of. Real breakthroughs came about though in the 1860’s with the development of germ theory by Louis Pasteur. Pasteur proved the before-speculated hypothesis that microscopic organisms were the cause for diseases. He then suggested the cleaning of surgical sites with boric acid. Joseph Lister, having read Pasteur’s work, took this to practice with carbolic acid instead. By disinfecting wounds, and later experimenting with the sanitation of hands, instruments, and the operating theatre, with carbolic acid, Lister was able to significantly lower the rates of infection. Because of this, Lister is now known as the “father of antiseptic surgery” and his Listerian surgical principles are still learned today. Before these leaps in understanding though, surgery was a very dangerous thing to undergo. During the Civil War, the most common surgery was the amputation. Amputations during the war had very high mortality rates due to the field operations occurring in dirty, makeshift operating rooms and poor sanitation of instruments and the doctors’ garbs. Ohio State University’s History Department states that upper arm amputations had mortality rates of about 24%– meaning that over 1 in every 5 men to receive one died. The problem with amputations is that because of their high rates of infection at the time, another would often be required, usually having an even higher mortality rate. Pyemia, a form of blood poisoning that is the result of pus in the bloodstream, had a mortality rate of 90%, so often times, a secondary amputation would be necessary. Other infections such as tetanus had 87% mortality rates and would require the same. During this time period of concentrated surgeries that showcased an especial need for updated surgical practices, primary amputation mortality rate was a high 28% and secondary amputation mortality rate was 52%. These numbers are in large part due to the absence of sanitary practices that prevent nosocomial infections from occurring.

Fig 3. AA2Day. Bacterial growth in IV extension tubing after propofol injection.

Today, some of the most common HAIs include Central Line-Associated Bloodstream Infections (CLABSIs), Cather-Associated Urinary Tract Infections (CAUTIs), Ventilator-Associated Events (VAEs), Surgical Site Infections (SSIs), C. Difficile Events, and Methicillin-Resistant Staphylococcus aureus (MRSA) Bacteremia. Most HAIs are bacteria-based infections that occur at orifices and intravenous or surgical openings, high-risk areas for introducing foreign bodies into the blood-stream or tissues.

Despite the nature of HAIs and the large ramifications of their prevalence, their prevention is simple. Through simple practices such as proper donning and doffing of personal protective equipment (which includes gloves, goggles, caps, foot coverings, and a gown), disinfecting operating equipment, and proper cleaning of operating rooms, HAIs can be curbed significantly. All hospitals have some form of department or service they use that handles sterile processing. A sterile processing unit is an extremely thorough, technician-manned department that handles the cleaning and redistribution of operating instruments. With different chemicals and autoclaves (which are essentially very large pressure cookers that uses steam to sterilize), technicians are able to completely kill any bacteria, spores, or germs, that might be on the tools.

Though this is still a great problem in the United States, many organizations are doing the best they can to eliminate the occurrence of healthcare-associated infections. The CDC’s annual reports allow hospitals to track their progress against the rates that are associated with HAIs and many hospitals have quality assurance and sterilization adherence departments within them. As of now, we already know the greatest methods of lowering HAI rates. What we need to do is eliminate the negligence and procedural mistakes that cause them.

An Intro to Long-Term Care

Fig 1. North West Home Care Inc. Montana’s Leading Health Care Services.

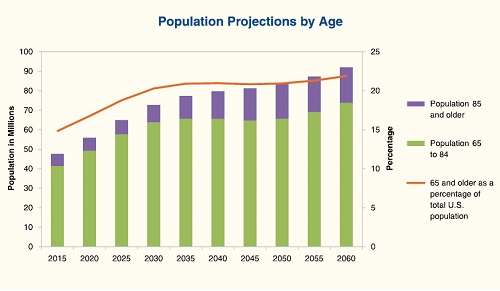
The state of long-term care services in the United States is of increasing interest. Geriatrics and the medical costs and supports associated with the field have found their place in the spotlight, due in large part to the Baby Boomer Generation. The Baby Boomer Generation refers to those born in the US between 1946 and 1964, following the end of World War II, according to Encyclopedia.com. The baby boomers total to about 79 million and, with this demographic reaching older ages, will soon cause a dramatic increase in the need for geriatricians and infrastructural growth in the health field of long-term care. By the year 2030, it is estimated that the 65-and-up demographic will total about 74 million, and 88.5 million by 2050.


Fig 2. Office of Policy Development and Research (PD&R) U.S. Department of Housing and Urban Development Secretary Ben Carson. Aging in Place: Facilitating Choice and Independence.

These statistics are more than US specific too, with other countries also experiencing “baby booms” similar to ours. The trends drawn from the international influx in these aging groups, are quite compelling. Perhaps the greatest indicator of a need for growth in long-term care are self-evaluations by those who would benefit. In the Health at a Glance 2017 annual report, published by the Organization for Economic Cooperation and Development (OECD), interesting trends in self-reported health and disability in the international 65-year-old population are identified. The report prefaces this section by acknowledging the subjectivity of patient self-evaluation, but recognizes the value of conclusions and correlations that may be drawn from such information. While cross-country correlation of perceived health status and general disability trends is more dangerous to presume, due to cultural differences regarding views of health, one can still observe continental relevance of coinciding trends, as well as trends established between countries of similar development and socio-economic factors. Assessments posed questions such as “How is your health in general?” and offered scales with ranges of negative and positive evaluations. Along with cross-country differences though, some countries utilized asymmetric scales, favoring positive evaluation, skewing results and comparisons. In the United States, approximately 75% of the age 65 population reported themselves in good health—though this might very well be due to asymmetric scaling, offering only a range of excellent, very good, good, fair, and poor. Comparatively, 14 of 34 OECD countries using symmetric scaling, reported only just over 50% of their 65-year-old populations in perceived good health. Assuming symmetric scaling of assessments portrays a more accurate depiction of global self-reported health in the 65 and up age bracket, about 50% of them fall under the “poor health” side of the spectrum. If this doesn’t change by the year 2030, it’s imaginable that nearly 37 million people, ages 65 and older, will be in perceived poor health. That’s far too great a number not to be concerned.

According to the CDC’s Long-Term Care Services in the United States: 2013 Overview, the state of long-term care in the US has undergone drastic changes over the last 40 years. Despite nursing homes still dominating as the top provider of long-term care services, utilization of skilled nursing facilities has been on the rise. Facilities like these are more geared towards short-term, post-acute, and rehabilitative care. These home- and community-based alternatives are most commonly seen in adult day services centers, and residential care communities. What this showcases is a conscious push in the way of preserving patient autonomy in aging population’s health decisions and care. One of the greatest hurdles in the growth and development of more comprehensive geriatric care is the transition between self-care and assisted care: when do providers take the reins and to what extent? Alternatives such as these offer a smoother transition for patients and their family. This growth, and an overall demand for more services in general has impressive projections. By the year 2050, the number of all geriatric care facilities (nursing facilities, hospice, alternative residential care places, home care services, etc.) are expected to increase from 15 million in 2000 to 27 million.

Fig 3. Harvard Health. What you can learn from the oldest old.

On top of the baby boomer contribution to the 65 and older population, an even more shocking statistic lies in the “oldest old”. The oldest old population is constituted by those aged 85 and older. This demographic is expected to triple from 6.3 million in 2015 to 17.9 million in 2050. As the CDC gathers, this will result in 4.5% of the total population falling under this description. The trouble with this age bracket is that they are far more likely to be widowed and without aid in their activities of daily living (ADLs), a common metric in geriatrics for assessing a timeline of care. Such a significant cut of the US population will need greater structure in the services they receive.

There is so much to do in the field of geriatrics. It’s seen by many as what is potentially going to be one of the most important and lucrative sub-fields of health care. With such a big shift on the horizon, it will be interesting to see the adaptations made by the industry for the predicted demand. I hope this post serves as a general run-down and PSA of long-term care and its growing need. Certainly, there is more involved than simply the numbers—in funding, socio-economic roles, and cultural backgrounds—but the need for infrastructural growth and a better understanding of aging populations is apparent.


Unnecessary Care

Fig 1. Pexels. Laboratory.

With monumental leaps in the technology and procedures implemented in health care today, receiving quality care has become far more feasible a goal, but costly as a result. But overly-comprehensive care does not always ensure the most effective results. While we now possess the ability to screen for so many possible causes of illness, unnecessary care has become a growing problem in American health care as our technology has increased.

According to Forbes, “overuse and unnecessary care accounts for anywhere from one-third to one-half of all health care costs, which equal hundreds of billions of dollars”. More specifically, a Kaiser Health News representative reported on a number of sites such as PBS and Health Care Finance that the losses due to unnecessary medical tests total at about 200 billion dollars. The mistakes and injuries that are a result of such overly aggressive care are believed to have caused nearly 30,000 deaths annually. With health care as a 3.4 trillion-dollar industry in the United States, we clearly cannot afford the costs of unnecessary procedures and care, both morally and economically. 

Due to a joint effort in California, three of the state’s largest health care purchasers are working to limit unnecessary medical expenses. Notable progress may be seen in San Diego where the Sharp Rees-Stealy Medical Group reported a 10 percent cut in unnecessary lab tests by simply educating doctors and patients about overuse. The Los Angeles County-University of Southern California Medical Center was able to remove unnecessary preoperative testing for routine cataract surgery and, consequently, the procedure was performed 6 months sooner on average.

Fig 2. Credit. Medical Bill Nightmares.

In Virginia, a grant was provided to calculate the amount of health care expenditures deemed wasteful in the state. The calculations observed administrative claims data and took into account not only Virginia hospital data, but the data of all the health insurance companies and all the health insurance plans offered and used in the state. As Dr. John Mafi, a lead author on a UCLA study observing these trends, points out, “most datasets don’t have this complete of a picture”. The UCLA team studying the data concluded that services providing no net health benefits to patients cost over 586 million dollars in the year 2014. While one must consider the size of health networks and the overall population of states, when looking at population density, Virginia ranks 20th nationally. With this in mind, the calculated 586 million dollars in waste expenditures for a state that falls nearly halfway in the national ranking for population density most likely pales in comparison to that of a larger state.

Many of the efforts being put in place to study this issue are the result of the Choosing Wisely campaign—a national campaign by the American Board of Internal Medicine (ABIM) Foundation, started in 2012. The organization asked a number of medical societies to identify at least five common medical tests or procedures that provide little benefit to consumers. While this campaign is a great start, it is still widely criticized for not targeting more costly procedures (e.g., arthroscopic knee surgeries and certain spine operations). Because of this, it hasn’t gained traction on a national level.

Fig 3. US News. What to Do When You Can’t Pay Medical Bills.

Things that the ABIM Foundation is targeting are the number of elective cesarean sections, reducing opioid use, and overtreatment of patients suffering low-back pain. The AARP recommends avoiding a number of tests and procedures, such as: routine presurgery tests for eye and other low-risk surgeries, screening tests for carotid artery disease without presenting symptoms prior, urinary catheters (as they are a common cause of hospital-acquired or nosocomial infections), and annual Pap smear tests. A big setback in cutting down on these procedures, according to Smart Care co-chairman, Dr. Richard Sun, is “developing metrics that everyone can agree upon to measure improvement”. The study out of UCLA, as reported on by Healthline, was quick to point out that many of these procedures are high-volume, but low-value. The definition of low-value procedures is offered as “patient care where the chance of harm is greater than the chance of benefit”. These procedures might often be low-cost, but due to their frequency of order, they are becoming a detriment to health and health care costs.

While we often approach problems with the “better safe than sorry” rationale, in medicine that is obviously not the best mode of action. High-risk and high-cost incurring procedures are often needlessly prescribed for patients. Whether it is through provider negligence, failure of coordinated care, or lack of education, superfluous procedures are a serious problem in the medical community and the country. The next time you or a loved one has concern over their medical condition, don’t lead with skepticism, but don’t be afraid to open a dialogue with your provider about these types of procedures. By doing so, and educating yourself prior, you can do a lot to avoid unnecessary medical care that might not only hurt your pocket, but you.

The Obesity Epidemic and Contributing Factors

Fig 1. Financial Tribune. Low-Income Families Face Childhood Obesity.


The National Center for Health Statistics reports that the percent of the US 20 years and older population with hypercholesterolemia has been on the rise. As explained, hypercholesterolemia is defined in the report as either a serum total cholesterol that is greater than or equal to 240 mg/dL or the taking of cholesterol-lowering medications. From 1988 to 1994, the percent population with hypercholesterolemia stood at 22.8%. Since then, that statistic has risen to 27.8%, between the years 2011 and 2014. This is an extremely troubling contributor in our nation’s growing obesity epidemic. As the CDC reports, more than one-third of US adults, 36.5% more specifically, are obese. On top of that, another third of Americans are classified as overweight. This reality is even more harrowing when considering its ramifications. A number of life-threatening conditions are associated with the label of obese. Conditions such as heart disease (the number one cause of death in America), some forms of cancer (the second cause of death in America), stroke (the number five cause of death in America, and type two diabetes (the seventh leading cause of death in America), are all associated with obesity. With obesity playing such a large role in the development of such hard-hitting diseases, its prevalence is all the more concerning.

Obesity is defined by a weight that is higher than what is considered as a healthy weight for a given height. This is screened for and calculated using the Body Mass Index (BMI). BMI is derived by dividing one’s weight in kilograms by their square height in meters. While this admittedly does not directly measure body fat, research supports a correlation between high BMIs and measures of body fat via skinfold thickness measurements, underwater weighing, and a number of other methods.

Fig 2. VeryWell. Who is to Blame for Childhood Obesity?.


Hypercholesterolemia’s upward trending is disconcerting due to its relationship with obesity. This particular trend is also nondiscriminatory across demographics. The increase in cholesterol’s prevalence throughout the 20 and older population may be observed across sexes and races, all with significant increases over the two-decade span. With America’s growing processed and junk food culture, the long-run playout of the situation at hand is frightening—assuming the rise will only continue. This is pertinent to the state of the US health care system, as high cholesterol intake and levels have large ramifications in terms of health and fiscally. High levels of cholesterol are indicative of obesity, hypertension, and atherosclerosis—influencers in the progression of heart disease, America’s number one cause of death, as mentioned before. The development of chronic illnesses like heart disease are huge cost generators, to both patients, providers, and insurers and will in turn raise the costs of health care services. Increased awareness of the causation behind these diseases would be efficacious in the areas of cost saving and death prevention. While small declines can be noted on the lower end of the 20 and older age spectrum, the incredibly high percent change in the older aged population towards increased cholesterol levels is something that must be curbed if one wishes to cut off heart disease in its formative stages. The hypercholesterolemia trend’s long-term effects in older generations will begin to manifest in the years to come and put a strain on long-term care—an area of health care that is already strained due to its relatively inconsistent modes of treatment.

Unfortunately, like many trends in health care, those with higher incomes are less likely to be affected by obesity, according to the CDC. Yet, The American Diabetes Association (ADA) reports that higher income countries still have greater rates of obesity than lower income countries. Contrasting international trends, the ADA reported findings stating that Americans who lived in the most poverty-dense counties were more prone to obesity. This is most likely due to the availability of cheaper-junk foods, a luxury that the poor of other countries might not have, and the lack of fresh food..

With hypercholesterolemia and obesity in the spotlight and the gravity of their growing presences realized, what we can do to curb them is a big topic of discussion in healthcare. In infants, Stanford Health Care states that “the longer babies are breastfed, the less likely they are to become overweight”. Breastfeeding an infant reduces their chances of becoming overweight by up to 25% and to do so for longer than 6 months raises that to nearly 40% less. In the adolescent population, genetics and lifestyle are marked as the key influencers in a child’s weight. With this, it is recommended to establish healthy and routine family eating and activity habits. These habits are sponsored all the same for adults, Stanford offering that eating a balanced diet and taking up an exercise routine can significantly lower rates of obesity and stave off the likelihood of becoming obese.

Fig 3. The National Baptist Convention. Let’s Move: Faith and Communities.


The evidence surrounding the American obesity epidemic is stacked high. The statistics that back this issue demonstrate that obesity is a mater of growing concern, as it slowly supplants itself as the norm. With nearly two-thirds of the population obese or overweight, the public should seriously look to implementing these preventative measures—as obvious as they might be. In terms of national concern and legislation, many campaigns are being run by both organizations and the federal government. These movements, such as Healthy People 2020, and Michelle Obama’s Let’s Move! campaign of 2010 are good starts in taking on this epidemic of national concern and get the ball rolling for causes of a similar nature.