What is Insights for ArcGIS?
Insights for ArcGIS enables you to explore spatial and nonspatial data on a topic in an interactive manner utilizing content for your ArcGIS Online account. Multiple files can be presented visually in a map, table, and/or chart form to inform decisions.
Getting Started?
Insights for ArcGIS Online works within the ArcGIS Online platform. Visit the Penn State ArcGIS Online Organizational Account. Upon authenticating to the Penn State ArcGIS Online Organizational Account, you also gain access to Insights for ArcGIS Online. Insights for ArcGIS Online can be accessed the App Launcher in the top right corner next to your profile name.
Information on getting started with Insights for ArcGIS Online (Esri)
Once enabled via the ArcGIS Online Organizational account, access Insights for ArcGIS Online. Start creating dashboard with spatial and nonspatial visualizations! Check out the examples below:
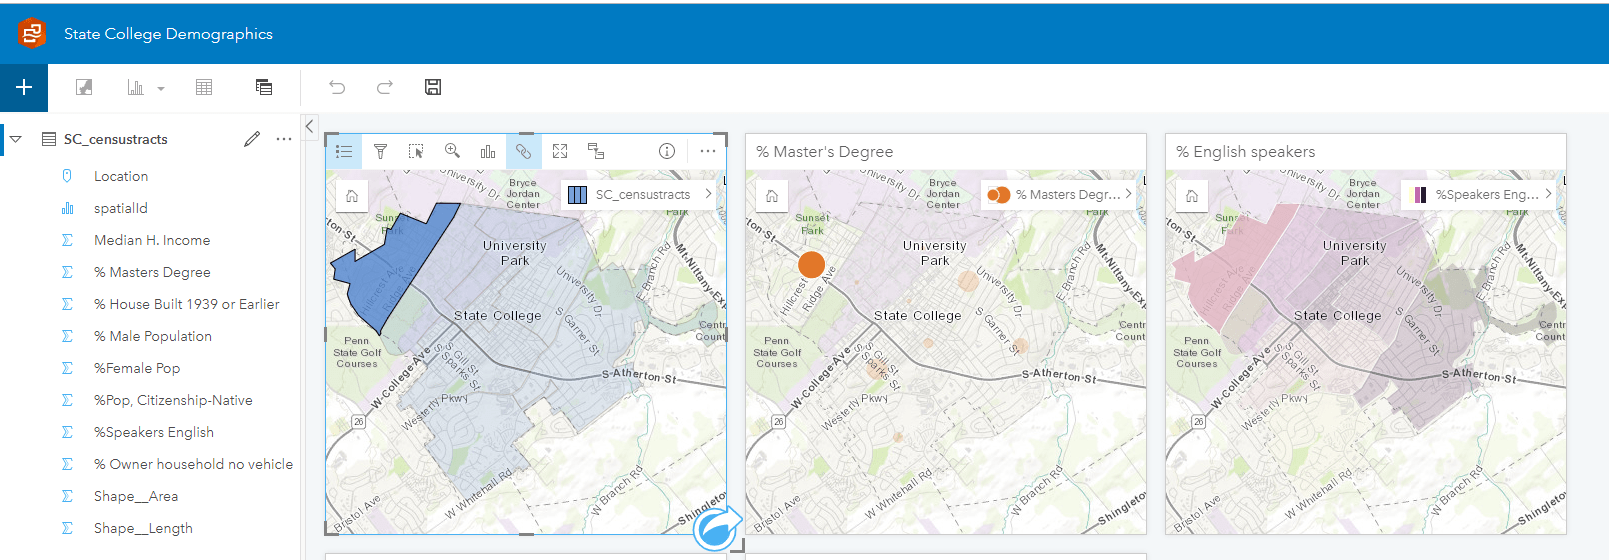
Example dashboard of State College Demographics
This example dashboard includes multiple demographic indicators for State College, PA obtained from the SimplyAnalytics application. SimplyAnalytics is available from the Penn State Libraries Database page.
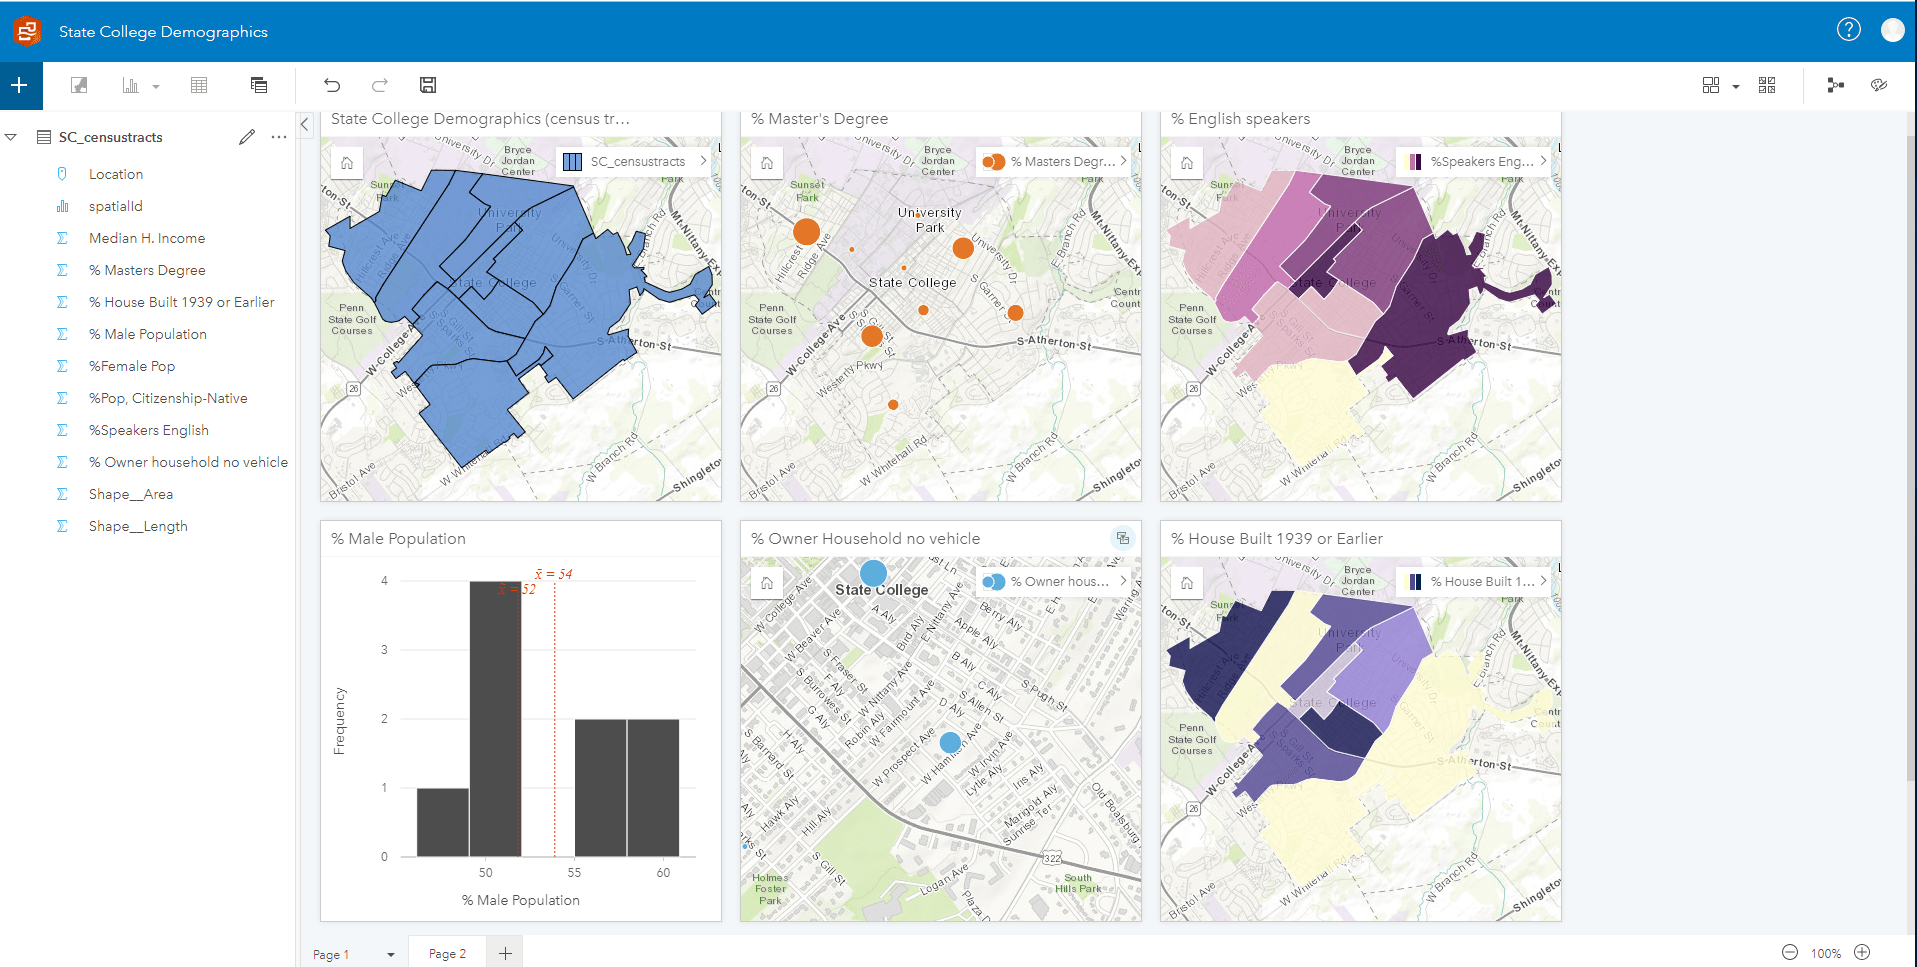
The dashboard cards can also be linked, for instance, when a census tract is selected in one car, the same census tract data or map information is more prominent in the other cards.
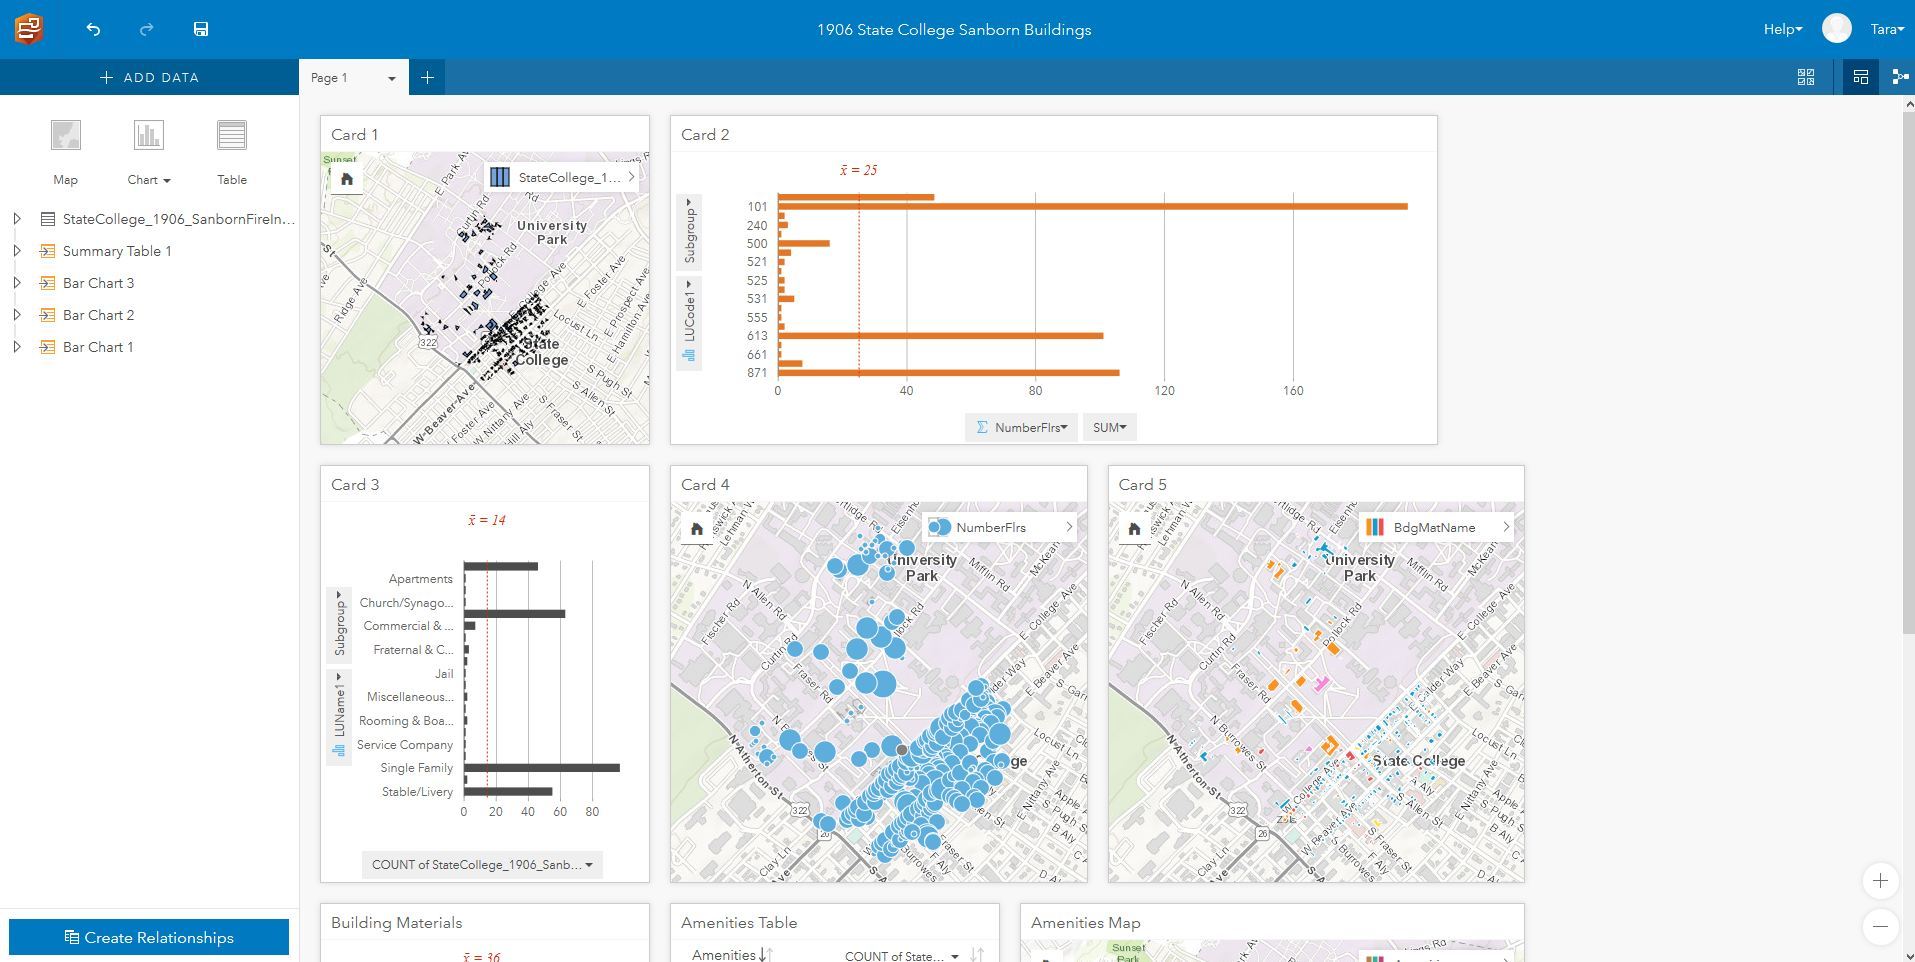
Example dashboard of a historic building layer for State College.
Using the loaded dataset, attributes can be dragged into the page and placed in a slot (card). The card can represent different forms of visualizations including map, table, chart,
Learn more about Insights for ArcGIS
These ArcGIS video provides an introduction to Insights for ArcGIS.
Submitted by Tara Anthony, GIS Specialist, Donald W. Hamer Center for Maps and Geospatial Information
Leave a Reply