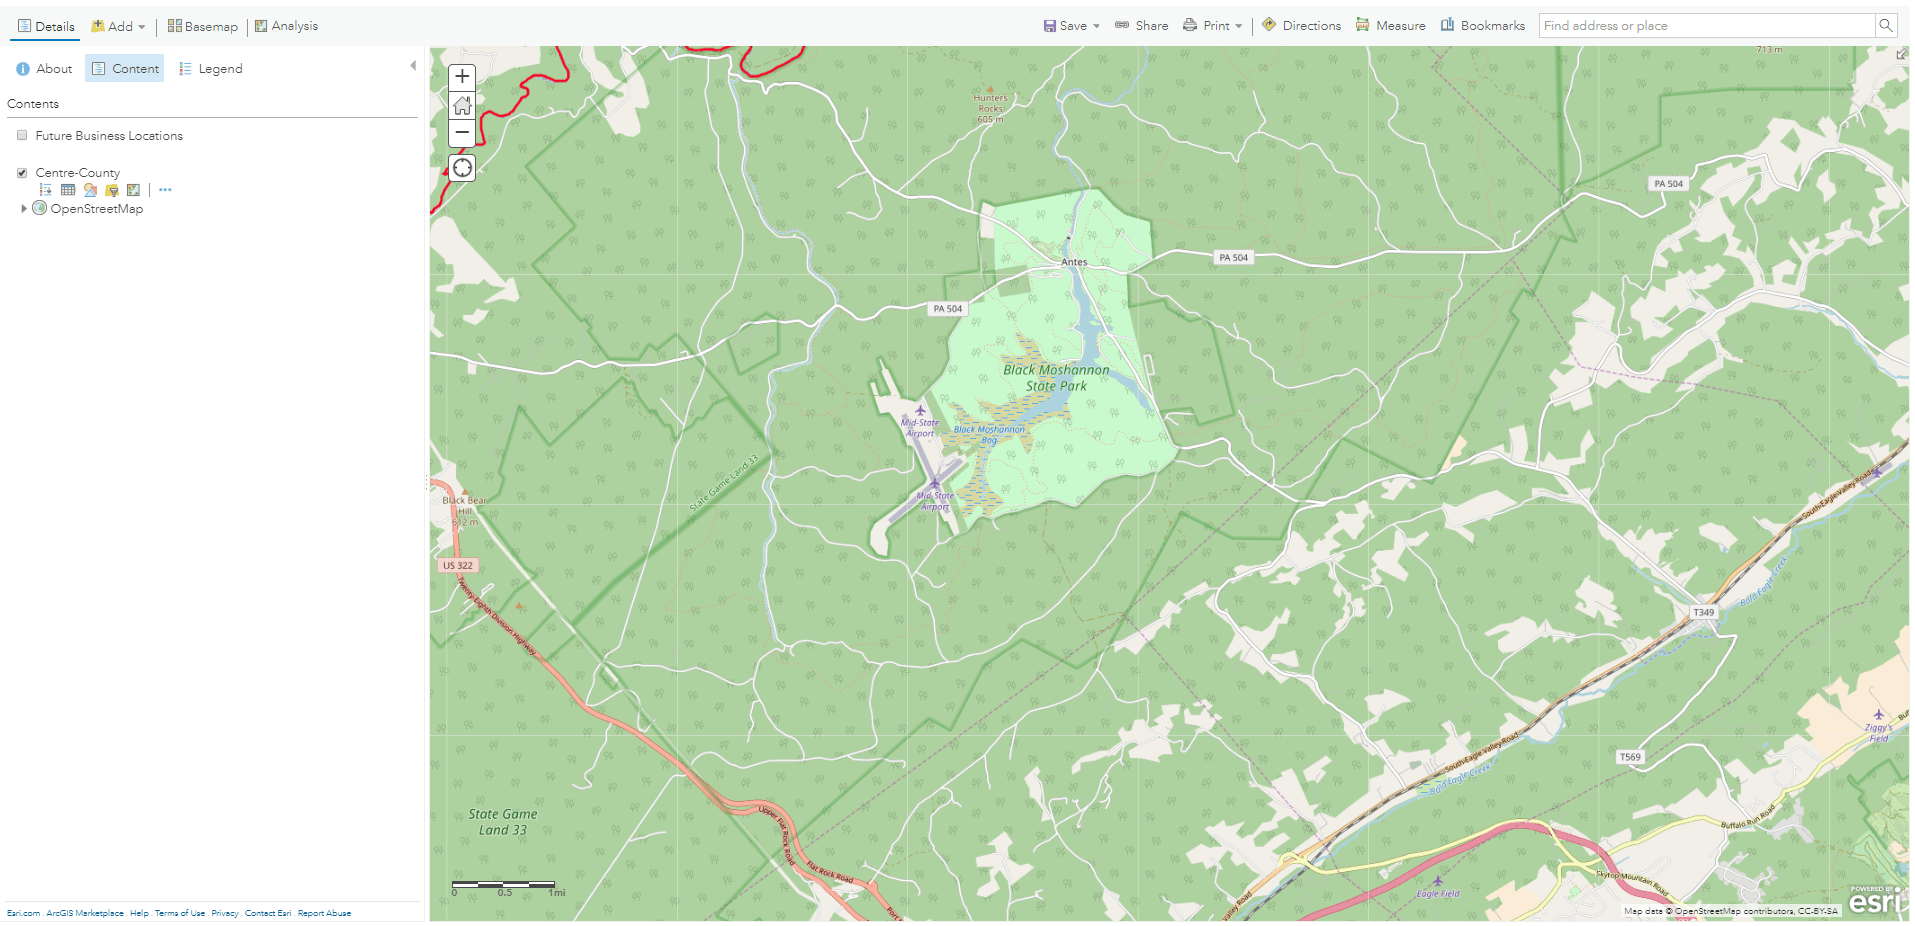
ArcGIS Online has multiple analysis tools built-in, which can help to elevate geospatial analysis conducted for study areas. Many users may be familiar with some of these tools from using similar tools in the desktop environment. This post includes a selection of examples from the ArcGIS Online Analysis options to consider using in geospatial projects. The key areas of Analysis options include: summarize data, enrich layer, find locations, analyze patterns, use proximity, and manage data.
These examples use ArcGIS Online data, such as Municipal Boundaries for Carbon County (provided by Carbon County, PA GIS), Pennsylvania, and Bridges in Carbon County, PA. Other types of data can be used and are encouraged, as these were chosen as sample datasets.
Summarize Data
Summarize Data includes functions for: Aggregate points, join features, summarize nearby, summarize within, and summarize center and dispersion.
Example with Aggregate Points
For instance, with an input of a point feature and polygon feature, this function can determine the which bridge points fall within the municipality areas.
In this example, the input is the point feature layer of bridges in Carbon County, PA, and polygon feature layer of municipalities for Carbon County, PA.
Input for Aggregate Points Analysis
Output from Aggregate Points
Output includes a summary of the number of bridges in each municipality.
Find Locations
Find locations include find existing locations, derive new locations, find centroids, find similar locations, choose best facilities, create viewshed, create watersheds, and trace downstream.
Example of Find Existing Locations
The find existing locations functions to select features that meet a certain criteria.
Example of the input for finding existing locations by an expression
Input is the AllBridges_Carbon feature layer
Enrich Layer
The enrich layer option enables the additional of demographic and other indicators to current layers.
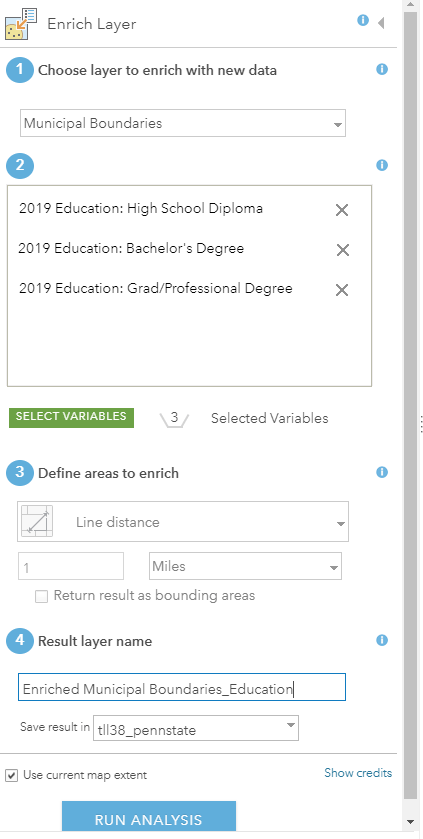
Example of enriching layer of municipalities
Select the feature layer to enrich, then select the variables for adding to chosen boundaries.
Input for Enriching Layer
Input includes the Carbon county municipal boundaries.
Output from the Enrich Layer Analysis
Analyze Patterns
Analyze Patterns includes calculate density, find hot spots, find outliers, find point clusters, and interpolate points.
Use Proximity
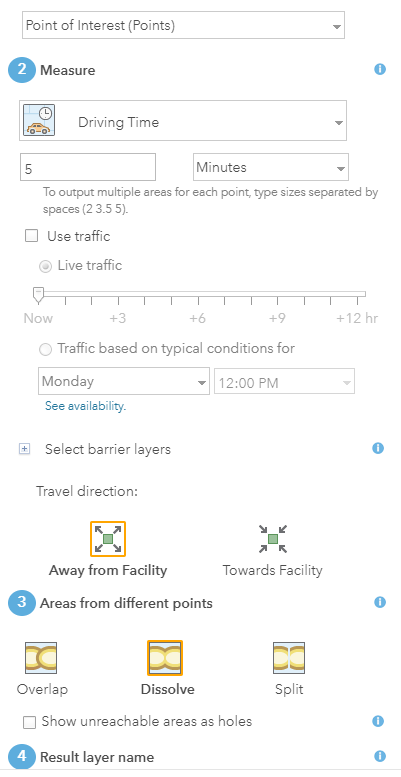
Use Proximity includes Create Buffers, Create Drive-Time Areas, Find Nearest, Plan Routes, and Connect Origins to Destinations.
Example for Create-Drive Times
Input includes a point of interest feature layer. This point was selected as a representative point.
Output includes the drive-time areas in purple from the point of interest.
Manage Data
Manage Data includes: Dissolve Boundaries, Extract Data, Generate Tessellations, Merge Layers, and Overlay Layers
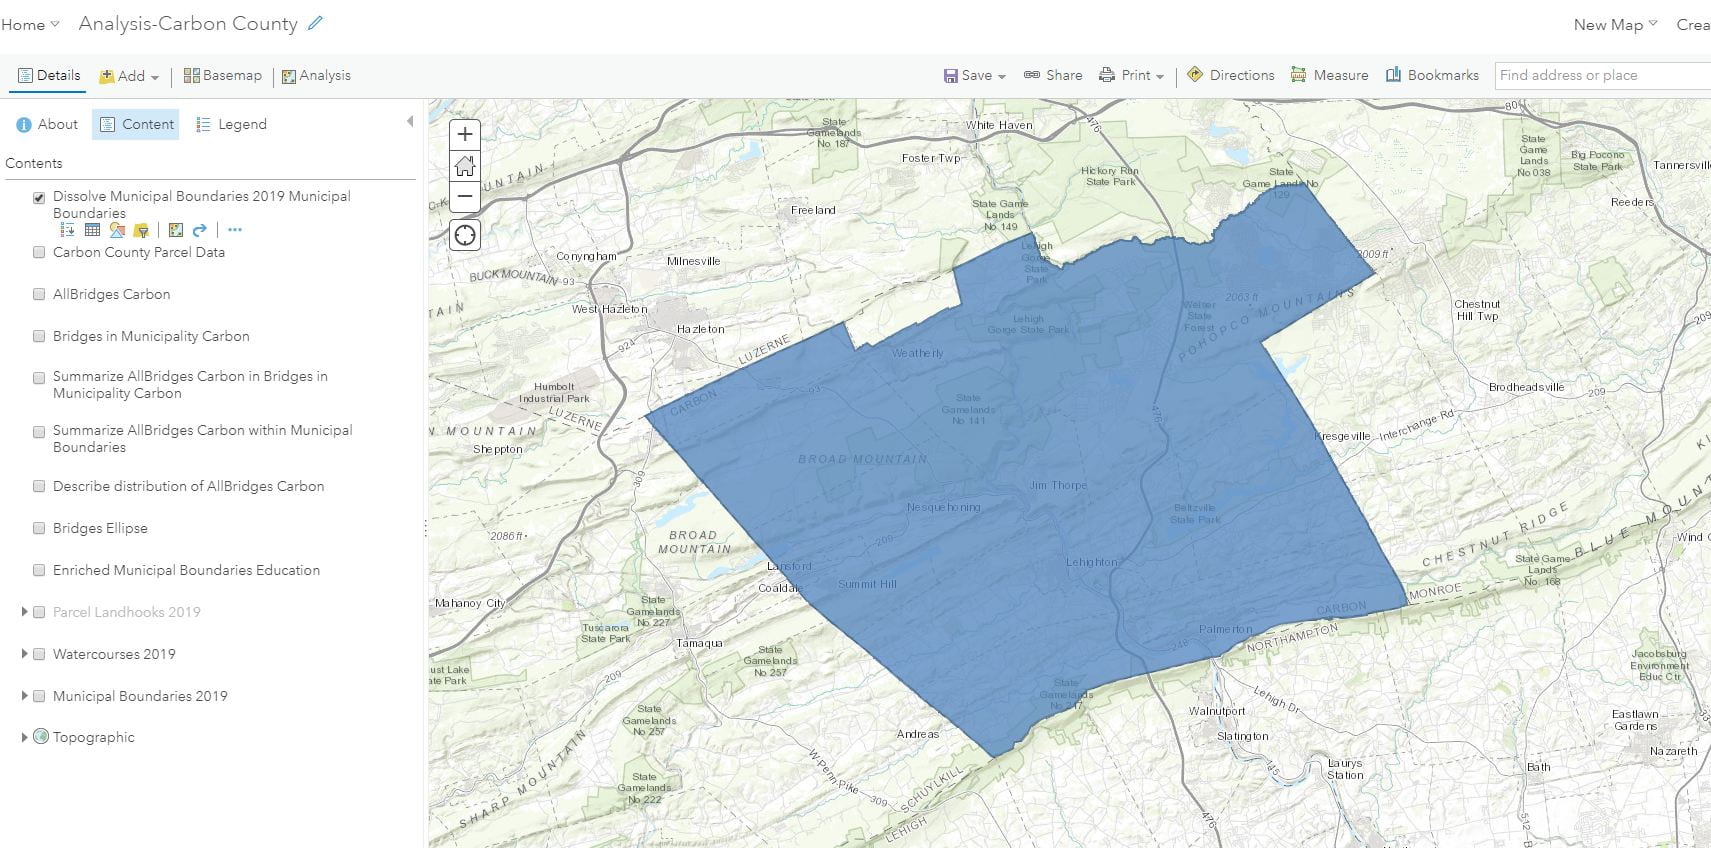
Example of the Dissolve Boundaries
Input includes the municipalities boundaries.
Output includes the dissolved boundaries to create the county border.
For more information on ArcGIS Online, see the Maps & Geospatial: ArcGIS Online Guide for additional examples, resources, and helpful links.


