All posts by Bryna Parlow

Basic Tastes are Anything but Basic

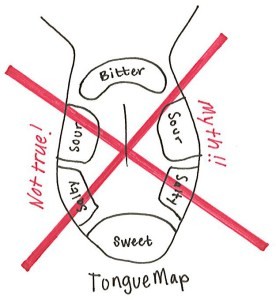
Ok, so now that we know that the tongue map is only a myth, let’s get to a topic that is thoroughly backed up with science- the basic tastes.

So what is a basic taste? Technically it’s a taste that one is able to distinguish through repeated tests and trials as a separate, singular taste. (So you’re clearly tasting one thing and not a combination of other tastes).

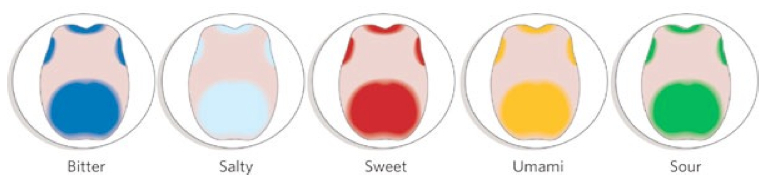
If you ask your local food/sensory scientist, they’ll be able to rattle off the five basic tastes without even thinking: sweet, salty, bitter, sour, and umami (savory). Research has shown that there may be another, but we’ll get to that later.

While the tongue maps is a bust, here’s what we do know about how these basic taste are detected all throughout the tongue. Tastants can either: flow directly through an ion channel, bind and block ion channels, or bind to a G-protein coupled receptor (GPCR).While that last sentence wasn’t the clearest the in world, hopefully this graphic will clear it up.

taste ways
This image shows how basic tastes move through a taste pore. These wouldn’t be happening all at once, but each pore will detect a single taste at a time.

In cognitive psychology, we’ve already seen an action potential before, that’s how nerve signals are transmitted throughout the body. It’s also the same way we taste sour and salty! You can remember because salts can be many ions including Na+ and Cl-, and sour tastes are acidic, so think of H+ ions. As seen on the Figure, the ions for salty and sour pass through an ion channel which causes that influx of sodium, leading to depolarization which then triggers potassium ions to move out. It is then at this point where calcium plays a role.

The tastes of sweet, bitter, and umami however go through different receptors. There are specific types of receptor depending on the taste (for example bitter is T2Rs). These receptors are held in place with the G-proteins, and after they pass through the process of depolarization starts, so the only difference is how the tastant first pass through the taste pore.

It’s important to note that serotonin, a neuromodulator we discussed, serves as a sort of intermediate transmitter to help communication between the taste pore and the rest of the taste bud.


So what about umami? It’s a word derived from the Japanese language, which translates into “pleasant savory taste”: umai means “delicious” and mi “taste.” (We’ll just agree that calling things “delicious” is not good scientific term”.

While savory is closest singular word to describe it, think of umami as the taste of chicken broth or a shitake mushroom. Monosodium glutamate (MSG), is also used as a descriptor for it. In addition to being in a variety of broths, the taste is also present in many Asian cuisines.

Remember how the defining characteristic of a basic taste is that it has to be distinguishable from all others? A characteristic like umami has been known in the scientific community as early at the 1910’s. However, proving that it was indeed a basic taste took some time.

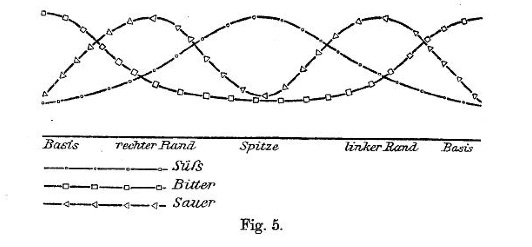
Shizuko Yamaguchi helped develop this graph which shows how the taste of umami “stands on its own” and isn’t dimensionally close to the other tastes.

umami
The graph isn’t labeled in this case because food scientists understand that these are dimensionless axes where the points are physically separated by how different they are.

Further scientific evidence also showed that umami had its own taste receptors, further cementing its place a basic taste.

receptors
The specific taste receptors for bitter, sweet, and umami. Notice how there numerous types of T2Ps bitter receptors.

While umami has been established, science is leading towards the discovery of another basic taste, it’s called oleogustus, the taste of fat (oleo is a Latin root meaning ‘oily’).

Out of Purdue University a study was done to see of participants could come up with words to describe the taste of fat. It was very important to the researchers that the participants didn’t confuse the texture of fat (creamy, smooth) with the taste.

hops
For example in a hops sorting task people would be asked to group the samples based on how they smell.

Participants were told to sort a variety of sample into different groups dependent on taste (often called a sorting task). While initially they placed the fat samples with the bitter samples, upon further testing between the fat and bitter they made a separate fatty acid group. While more research needs to be done (will they find a ‘fat’ receptor?), it’s an important step in the right direction.

Fun fact: Cordelia Running, who helped pioneer this study at Purdue, is now a post-doc in Food Science Department here at Penn State!

Reevaluating the Tongue Map

We’ve all probably heard something of some sort about “the tongue map” –the idea that different parts of our tongues are used to distinguish different basic tastes such as sweet, salty, and bitter. For example, the tongue ma below would suggest only the tips of our tongues are used to taste sweetness.

In fact, I remember a PSSA question in middle school that revolved around a story about dipping Q-tips in salt water and dabbing it around your tongue to see where you tasted salt.

hdceH
(We’ll ignore the fact that this already-false tongue map excludes the fifth basic taste, umami, which is savory, and save that for another post.)

What we know presently, however, is that the tongue map is a misconception. So how did the myth start and what does science tell us about the “the tongue map” today?

It turns out the theory of the tongue map began with something a lot of us know all too well: a miscommunication. Back in the very early 1900’s, a German scientist by the name of D.P. Hanig published research (Zur Psychophysik des Geschmackssinnes… say that 5 times fast) indicating that his participants could indeed detect a variety of tastes on all parts of the tongue. He also reported that different areas of the tongue seemed to have different sensitivities for the tastes, though these differences were small.

Flash forward about 40 years. That was when a prominent Harvard psychologist Edwin Boring took Hanig’s research and re-plotted it in a way so that those relatively tiny differences between sensitivities in different areas of the tongue seemed much larger than they actually were.

How did he do this? Take a look at the original graph by Hanig below:

hanigggg

Ignoring the fact that it’s in German, anyone who has had to make a graph in school knows this blatantly goes against the rules. Notice how the y-axis isn’t even labeled, let alone marked with a scale and units. Without a proper scale to go by, Boring just assumed the sensitivity thresholds at the bottom were equal to zero, when if he in fact looked through the mounds and mounds of German text he would have seen that these were not absolute sensitivities but relative sensitivities. Whoops.

Scientists and historians looked at Boring’s Sensation and Perception in the History of Experimental Psychology and the idea of the “tongue map” was born.

This was an actual graph from Boring’s Sensation and Perception in the History of Experimental Psychology (1942). Notice how the sensitivities seem to largely differ depending on the location of the tongue.

Also notice how both of these graphs had no error bars. Without them, anyone who looks at that graph will have no way of knowing if those clearly visible differences in height between the tastes are actually statistically significant. So if there’s anything to be learned from this (besides the myth of the tongue map of course), it’s to properly label your graphs and include error bars if necessary!

Though you may have had experiences in early education dealing with the tongue map, research to disprove it was being conducted as early as the 1970’s. Virginia Collings conducted one of the more important studies at that time. She essentially re-proved the same concept that Hanig did originally- that the differences in sensitivities of taste around the tongue were trivial.

Countless studies have since been published that disprove the “tongue map” concept. Here’s what we know about tastes on the tongue today. The main areas you can taste on the tongue are where the lingual papillae are located, since they contain your taste buds. This includes fungiform papillae on the front and sides of your tongue, foliate papillae on the back sides, and circumvallate papillae on the very back of the tongue (as you can see from this image)

tongueee

All of our taste buds contain taste receptor cells, which are capable of distinguishing all five basic tastes (and possibly a sixth, but more on that later).

So even decades after the tongue map has been disproven, why are we still talking about it? It could very well be that people simply enjoy the idea of a map, since it’s visually appealing. It would be nice to think that each taste has their own specific area on the tongue, and it doesn’t deviate from that. We like things that are divided into neat, clear categories, and for a while it appeared that the tongue and basic tastes were one of those things.

It’s also quite easy to fool yourself with expectations, like with top-down processing. For example if you have the expectation that a bitter compound is going to taste stronger, you may rate it as such without really thinking about it (even though it may be just as intense as a sweet-tasting compound).

And as for a true “tongue map?”

Here you go: true taste map

Yes indeed, these colored areas, where the concentrations of papillae are highest, are where all of the basic tastes can be detected.

Unknown
Tongue-Map-Myth