Author Archives: Gregory Giliberti

Being Ambidextrous: More than Meets the Hand(s)

When you reach for a glass of water which hand do you use? When you take a test, which hand do you use to bubble in your answers? Is it the same hand? Is it the opposite one? Do you ever give it a second thought? Though which hand you use for everyday tasks may seem simple in nature, there is a vast amount of science being done behind the scenes to see what it all means, and what it could mean for the future.

To start, the American Psychological Association says that approximately 90 percent of the human population is right handed. Only about 1 percent of the human population is born ambidextrous. That also means that the other 9 percent are either left hand dominant or are mixed handed. Mixed handed refers to the idea that one hand is dominant for some tasks while the other hand is dominant for others. This is different from ambidexterity which is the ability to use either hand just as efficiently on any task. Unfortunately, there is currently no consensus in the scientific community on what handedness means, or how many classifications there should be for it. Indiana University recognizes this lack of standards throughout the scientific community. They go on to state that there is a clear difference between ambidextrous, and mixed handedness. So potentially, one can be right handed, left handed, cross dominant (mixed handed), or truly ambidextrous.

In an attempt to clear up some of the confusion, the Department of Psychiatry and Neurology at Tulane University performed a study that measured combinations of hand preference and hand performance to try to better classify groups of handedness. They studied 64 participants and found that more than 90 percent of the time, the hand you performed better with was the same hand you preferred or were more comfortable with. This study basically shows that handedness is not a clear-cut answer and that there is a spectrum of cross dominance between the two hands. This can be due to predetermined parts of the brain (nature), and which hand the person is forced to use at an early age (nurture).

On that note, one’s dominant hand is not determined from strictly nature or nurture but more of a combination of the two. Dana Smith, who has a Ph.D is psychology, reports that there are many genes known to be associated with handedness. So, when a child is born, they have a clear preference. Smith then goes on to say that this preference can try to be switched early on in a child’s life while he or she is still making neurological connections and pathways in the brain. When this happens, they become mixed handed and show signs of both the nature and nurture aspects of handedness.

So right about now you may be asking yourself, “Why does this matter?” It turns out there are many health and psychological problems that stem from handedness. Well, maybe not handedness, but more importantly brain lateralization. Brain lateralization is the idea that the brain has two hemispheres that compartmentalize and perform certain cognitive functions. For example, the left side of the brain is known to handle the use and understanding of language and speech. Though there seems to be correlation, the science is still not conclusive that right-handed people are left-brain dominant and left-handed people are right-brain dominant. However, through brain scans, we can determine which hemisphere is dominant on most humans. Once that is known, this leads to the knowledge of other things. For example, those who are left brain dominant tend to be better at analytical thinking while those that are right brain dominant tend to recognize patterns easier and have an easier time seeing the bigger picture to things.

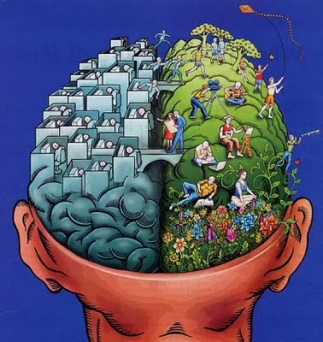
However, there is a special breed of human that does not have an asymmetrical brain. Instead, they have brains that are much more symmetrical. This leads to the health and psychological problems I mentioned earlier. This breed of humans is the 1 percent: the ambidextrous.

The American Academy of Pediatrics published a study performed by Alina Rodriquez and other researchers that measured these health complications. Rodriquez measured 7871 children from Finland at the ages of 7-8 and again when they were 16. She found that at age 8, those who were ambidextrous were twice as likely to struggle with language skills and academics compared to those who were right handed. Also, at the age of 16, those who were ambidextrous were twice as likely to have these same struggles with school and language. They were also twice as likely to exhibit signs of ADHD compared to right-handers. And when comparing just the 16 year olds that were showing signs of ADHD, the ones who were ambidextrous seemed to have the more severe symptoms compared to those who were right handed.

Reflecting on this study, I would be wary to conclude anything about the whole human population based off of one study with one nationality of subjects. I would feel more comfortable if the study was repeated multiple times and used a broader group of individuals to sample. Also, the study mentions that the data they received was purely based on surveys distributed to people around the subjects like their parents and teachers. For one, parents may be hesitant to answer truthfully about whether or not their child has learning difficulties for various reasons such as pride or denial. That alone can introduce a level of bias. Furthermore, like I mentioned, these results are based off of surveys. Since no experimental variable was manipulated, this was not an experiment. That means there is no definite way of knowing handedness caused the increased numbers in health problems. The study is also not specific with its numbers. It is stated that those who are ambidextrous are twice as likely to have some of the psychological problems compared to right handers but do not provide a baseline risk. By only giving relative risk, it can be deceiving to those who read this study. For example, if 1 righty has ADHD and 2 ambidextrous children have ADHD, it is twice as likely. Not all statistically significant results are practically significant. .

Nonetheless, Rodriquez concluded from her study that her results could be due to “atypical cerebral asymmetry.” She also goes on to state that more research needs to be done on the biological mechanisms to this phenomenon. There is no clear answer as to what causes a brain to be symmetrical. There could be a third variable driving the relationship between brain lateralization and dexterity. If we can learn the connection between brain lateralization and handedness, we as a society can help pinpoint those who may be at risk of these health problems and give them the help they need without using invasive neurological procedures.

As of now, if one wants to know what hemispheres of the brain are specializing in certain tasks, a Wada test must be administered. A Wada test essentially hibernates one side of the brain so doctors can see what cognitive functions the side of the brain that is not hibernated is responsible for. This process can be costly and have health complications. The Department of Neurology at the Cleveland Clinic performed an analysis of 677 patients that had undergone the Wada test. A combined 10.9 percent experienced some type of health complication. 7.2 percent had encephalopathy, 1.2 percent had seizures, 0.6 percent had a stroke, 0.6 percent had transient ischemic attacks, 0.6 percent had a localized hemorrhage at the catheter insertion site, 0.4 percent had carotid artery dissections, 0.3 percent had an allergic reaction to contrast, and 0.1 percent experienced an infection.

Handedness can be a way of knowing about one’s brain lateralization without using this invasive and expensive test. It would be amazing to see if just by running a few tests focused on hand dominance, we can know a plentitude about the functions of that individual’s brain. Science is getting better but it is imperative for more direct studies to be performed. The only way to be certain about anything is to prove causation through repeated experimentation. We know there are links between certain diseases like ADHD and ambidexterity and we know there is a relationship between ambidexterity and symmetrical brains, but how is this all connected? It is still unclear and maybe there is a third confounding variable that has yet to be discovered.

An experiment I would propose would be to manipulate several genes such as PCSK6 and LRRTM1, which are known to be associated with hand dominance, and see how they affect one’s chances of developing a known side affect to ambidexterity such as ADHD. Once we unlock the answer to this question, the possibilities for medicine and science are endless.

Photo URLs

Photo 1

Photo 2

Photo 3

Photo 4

Can TV Cause Nearsightedness?

“Don’t sit too close to the TV. You’ll ruin your eyes,” said every mom that ever existed. Since the 1960’s, parents all around the world have been telling their kids that sitting too close to a screen will cause them to go blind. This may be a myth. So why do parents continue to preach this possibly false claim to their kids? One reason is because of a little lie parents were telling that stuck around for too long, and the other is an error in the interpretation of causation. Lets see if there is any scientific evidence to suggest TV can cause you to go blind.

To start, I want to take you back to the 1960’s. Tube TV’s were the current form of entertainment. Unfortunately, back then, the technology was not very safe. An electron gun drew a picture on a phosphorus-coated glass and vacuum tubes supported the electronics. This emitted low amounts of x-rays. However, in one instance, the company General Electric had to recall a great number of tube TV’s because they were emitting excessive amounts of x-rays through the vents in the front of the TV’s. When this happened, mothers became very cautious about letting their kids sit too close to the TV due to a fear of possible x-ray exposure, so they told them they would go blind. The x-ray problem in TV’s was eventually fixed, but the little white lie stuck around.

The other reason parents continue to hassle kids about their proximity to the TV is the parent’s anecdotal evidence they receive when their child who sits a foot away from the TV needs glasses a year later. This does not prove causation. Actually, reverse causation seems more plausible in my opinion. For example, those who sit close to the TV probably already have a condition called myopia (nearsightedness). When the child needs glasses a year later, the parent falsely believes it was the TV that caused the myopia. Unfortunately for mom and dad, I took Science 200 and recognize there is no evidence that sitting close to a TV causes myopia. In fact current research is finding other causes to nearsightedness.


Though I could not find I study to disprove TV causing nearsightedness, I found an observational study that suggests it could be other factors. This study measured 13 possible predictors to childhood myopia in 4927 children aged 7 to 13. The predictors were measured by first observing whether the predictor was present in the subject (astigmatism magnitude, crystalline lens thickness, etc.). Basically, a predictor was a certain biological feature on or part of the eye. Then the researcher statistically correlated the predictors with whether or not the child had myopia. It turns out that the “spherical equivalent refractive error” showed the highest correlation to the myopia. Since it was an observational study, the researcher was only able to show a positive association between this certain biological feature of one’s eye (spherical equivalent refractive error), and the disease myopia, nothing causal.

This study has its limitations as well. Like I just mentioned, it is an observational study so there is no way of proving spherical equivalent refractive error caused the myopia seen in children. Also, the study was limited to the 13 predictors of myopia the researcher chose to observe. When I realized this, it made me wonder whether the researcher missed a predictor in her list of 13. You cannot measure something you do not think of, which is a definite limitation to this study design. Finally, the study’s population is children. It would not be accurate to extend these results to adults as well, who are also susceptible to myopia.

However, one thing I like about this study is the large sample size. Since it wasn’t an experiment, we can’t prove causation, but at least the large sample size allows us to extend the association to the population.

To answer my original question, I would propose an experiment that directly analyzes whether TV causes myopia. I would collect a large random sample of children in the same age group as the previous study, but then randomly assign them to a group that spends 5 hours a day in front a TV for a month, and a group that watches no TV for a month. I would then compare the groups with a matched pairs design by administering a “far away” reading test. This would allow a more causal relationship between TV and myopia to be formed.

So what does this all mean? Basically, no ophthalmology expert website that I could find believes TV causes nearsightedness, and this study I analyzed also does not recognize TV as a predictor. That is why setting up an experiment like I proposed may finally end the debate. As for now, I think whether you choose to sit close to the TV should depend on how much it means to you (like Andrew’s classic beer example). If sitting close to the TV is something you cannot live without, I would suggest you keep doing it since there is no evidence showing it to cause blindness. However, if you do not care where you sit, you might as well sit farther away due to the possible unproven risk of developing myopia. This will not only keep your parents quiet, but will guarantee your safety until more conclusive evidence is discovered.

Photo URLs

Photo 1

Photo 2

Photo 3

Need Help Staying Awake?

Imagine this. You are pulling an all-nighter to study for final and you are beginning to feel exhausted. You contemplate whether to take a nap of grab a cup a coffee. It turns out you might want to do both! Have you ever heard of a coffee nap? A coffee nap is the practice of drinking coffee, then immediately taking a nap for 20 minutes before the caffeine kicks in. Who thought of such a thing and why are people doing it? It turns out, some studies are showing that taking a coffee nap is more effective in keeping you awake than drinking coffee alone or taking a nap alone. Lets see if there is any reason to believe coffee naps can live up to the hype they are receiving.

To see if this theory even makes sense, I did some research on what makes us sleepy. Humans make a chemical called adenosine. Adenosine continues to build up the longer a person stays awake. Adenosine plugs in to receptors inside your brain cells that indicate to the body you should be feeling more and more tired. This produces grogginess and is supposed to help you realize you need sleep. Adenosine levels drop as soon as you get that rest. Since caffeine has a similar chemical makeup to adenosine, it fits into these adenosine receptors, which blocks adenosine from entering. Since caffeine does not make you feel groggy, you never experience adenosine’s effects. It all comes together when you combine the two activities. Now, as sleep clears the brain of adenosine, the caffeine has no other chemicals to compete with to fill these receptors.

In theory this makes sense, but what is the science that this actually works? I found a study that tested 5 different treatments on their effectiveness of curing mid afternoon sleepiness. The 5 different treatments were drinking caffeine followed by a nap, being exposed to bright light for a minute after napping, washing the face after napping, taking a nap, and not napping at all. The subjects in each group were measured by their reaction times to an online memory test before and after their naps. It was found that the group that had caffeine before their 20-minute nap had an increase in reaction time on the memory test by 9.1 milliseconds. The group that just took a nap had an increase in reaction time as well, but only by .1 milliseconds. Also, the group that did not nap had a decrease in their reaction times by 11.6 milliseconds.

There were a few things I liked about this study. First, the design seemed logical as each person went through each treatment. This would control for third confounding variables such as the slightly different ways caffeine affects each person (some people have caffeine tolerances). It sort of levels the playing field. Also, doing a before and after test was much better than doing one test after the nap since each group had a baseline of comparison.

Unfortunately, there were many more issues with this study than good parts. For one, the sample size was only ten people. This is not a large enough sample to extend any conclusions to the population. Also, the changes in reaction time were in milliseconds. It is unclear to me whether 9 milliseconds is grounds for concluding that caffeine plus sleep is any more effective to keep you awake versus just taking a nap. Finally, this experiment may suffer from the Texas sharp shooter problem. There was no need to measure bright light or face wash after napping in this experiment. Bright light, face wash, and caffeine are all so different, it leads me to believe the researcher may have just been looking for something that stands out in the data. I realize 5 is not a huge amount of treatments to be sure this is suffering from the Texas sharp shooter problem, but it is still a red flag that all of these treatments were measured in the same study.

This one experiment is not enough to convince me coffee naps definitely cause a greater reduction of sleepiness than coffee or a nap alone. I would like to propose a more focused experiment that would involve three groups. The first group would drink a 12-ounce cup of coffee plus take a 20-minute nap. The second group would drink a 12-ounce cup of coffee. The third group would take a 20-minute nap. I would want at least 30 people in each group, making for a total sample size of at least 90. Also, I would measure their brain activity before and after the treatments using a multiple sleep latency test. The amount of brain activity a person had would be an indicator of their sleepiness. This way of measuring sleepiness is probably less prone to error than a reaction time test.

So what does this all mean? Though there is no conclusive evidence that coffee naps are effective in keeping you awake, it is one of those instances where it can’t hurt to try it out. There is no immediate risk in coffee naps, and since there is a possibility it may help you stay awake, give it a try! Just be aware more research needs to be done in order to see if there is actually a causal relationship between coffee naps and wakefulness.

Here is the video that inspired me to write about this topic!

Photo URLs

Photo 1

Photo 2

What Causes Addiction?

“I love you.” These three words may be the solution to a problem that has existed for well over 100 years. Many believe drug addiction occurs because of chemicals in the drugs that have addictive properties. However, new evidence suggests that addiction is caused by our environment, not chemicals.

First, addiction has a few definitions. It is the inability to abstain from something, or the craving and desire for something. Addiction is also associated with a diminished recognition of serious problems, and changes to one’s normal behavior and emotions.

In many classic addiction studies, rats were put in a cage with 2 water bottles, one laced with heroine and one with just water, and they almost always chose the bottle laced with the drug. Though this seems logical, Bruce Alexander, a professor of psychology in Vancouver, found an error in this experimental design. The rats were placed in the cages alone. Alexander thought that maybe this addiction came from animal’s innate need to bond to something, and not having anything else to bond to. To see if his thoughts were valid, he designed a group of experiments known as the Rat Park Experiments. These experiments concluded that rats that were in a loving environment (Rat Park) did not become addicted to heroine (a drug believed to have chemical properties of addiction), when given the choice between heroine-laced water, and plain water. Rat Park was Alexander’s loving environment he created for the rats. It had lots of cheese, tons of space, and most importantly, lots of other rats to have friendships and sexual relations with.

In one specific study done by Alexander, he supports this hypothesis that addiction stems from one’s environment, not the chemicals. The rats were separated into four groups: a group that lived in a lab cage, a group that lived in Rat Park, a group born and raised in the lab cages and then switched to Rat Park at the beginning of the experiment, and a group that was born and raised in Rat Park an then switched to the lab cages at the beginning of the experiment. The rats’ addiction was measured by the weights of the two water bottles (drug bottle and plain water bottle) at the ned of each day.

What Alexander found was that the rats that were caged drank 19 times more heroine-laced water than the group of rats in Rat Park! It also seemed that where the rat was born did not have much influence on whether or not they became addicted to the heroine. The only time there was an exception to these findings was when the experimenter diluted the heroine-laced water. When the heroine-laced water was diluted, rats that lived in Rat Park but were born in the lab cages drank just as much of the drug water as the rats that spent their entire lives in the lab cages. I cannot think of any logical reasoning as to why that is. Maybe someone can share their thoughts in the comments.

A view of Rat Park

Honestly, there was not much to critique about Alexander’s experimental design. I could not find sample sizes of this specific experiment, but I know he repeated all of his studies with Rat Park multiple times. This has been Alexander’s main research since 1970! But, as an informed consumer of science, since I do not know the exact sample sizes, or how many times Alexander repeated his studies, I will take his discoveries with a grain of salt. Also, his study was done on rats and not humans. Anytime a study is tries to conclude things about the human population but doesn’t test on humans, there is a bit more uncertainty involved. I would propose running a similar experiment on humans, but I do not believe it is ethical to drug humans!

My only complaint with this series of experiments is the fact that the findings are limited to saying it was a “loving environment” that caused the reduced drug addiction. Since Rat Park had many components in it, it is impossible to see if any one of these variables had a direct causal relationship with decreased drug water use. Like I mentioned before, Rat Park had lots of cheese, tons of space, and most importantly, lots of other rats to have friendships and sexual relations with. It is not clear to me if one, all, or a combination of these factors were the reason for the reduced use of the heroine-laced water. For example, I would be wary to conclude that it was the extra space that caused decreased addiction to the drug because the tons of extra food, ability to have friends, and ability to have sex could all be confounding variables.

To try to pinpoint what was the exact cause to decreased drug addiction, I propose a group of experiments that tests each one of these components of Rat Park separately. This would mean having one experiment that gives one group of rats more space than the control group, another experiment that gives one group of rats more cheese than the control group, another experiment that gives one group of rats friends while mice in the control group are isolated, and a final experiment that gives one group of rats an even split of males and females to have sex, and the control group of rats with either all males or all females. This will help find which part of Rat Park, if any individual part at all,  is causing the reduced drug addiction.

However, it may just be the combination of these factors that is causing the reduced drug addiction. This would mean it was the “loving environment” causing the reduced drug addiction, just as Alexander hypothesized. As the research stands right now, Alexander’s hypothesis of a “loving environment” causing decreased addiction to supposed “addictive drugs” seems pretty convincing to me.

So what does this all mean? It means that we need to stop punishing people for their addictions, and instead recognize why their addictions exist. If this study is correct, we need to realize people have these addictions because they are missing key bonds (especially social) normally present in a loving environment. These addicts are bonding to the drugs instead. So, next time you see an addict you care about, say, “I love you.” It may just make all the difference.


Watch this TED Talk given by Johann Hari. It goes into more depth on the consequences to the way we as a society currently treat addiction.


Also, if the specific study of Rat Park wasn’t convincing enough, I found this video that shows how Alexander drugged the rats for 57 days before the experiment, and the rats in Rat Park still did not go for heroine-laced water!

Photo URLs

Photo 1

Photo 2

Photo 3

Male Pattern Baldness: Examining Alternative Treatments

I am 18 years old and am already noticing that my hairline is beginning to recede. Granted, baldness runs in my family so maybe I should have seen this coming. Over 50 percent of men will have to deal with this problem by the time they are 50, and it can be quite demoralizing. So is there an answer to male pattern baldness? Medicine is good right now and it is getting better, but there still is no perfect cure. Right now, the best thing we can do is delay the balding process. Maybe a look at what researchers are currently testing will show us what needs to be discovered and where science must eventually progress to help solve this issue.

To start, the cause to male pattern baldness, more formally known as androgenetic alopecia, is not fully understood. This is part of the reason why there is still no perfect cure to the problem. As of now, what we know is men that experience androgenetic alopecia have hair follicles that are sensitive to Dihydrotestosterone (DHT). Dihydrotestosterone is a hormone that is responsible for male sexual development, regulating hair growth, regulating sex drive, and most importantly, shrinking hair follicles over time. So, to stop hair loss, it seems we have to slow the production of DHT.

The FDA currently approves two treatments for androgenetic alopecia: Finasteride, which inhibits Type II 5-alpha-reductace, lowering DHT, and Minoxidil, a topical solution. However, since minoxidil does not do anything to stop the production of DHT, there are usually no long-term effects.


This is the Hamilton-Norwood scale, which measures the progression of androgenetic alopecia

As a male who is at the beginning stages of this process (I am at a 2 on the Hamilton-Norwood Scale), I want as much research being done as possible. There has been plenty of research to find the best inhibitors of DHT, but I wonder if DHT is not the only cause to hair loss. Two experimental treatments I will examine are caffeine and microneedling.

In 2011, there was a study done in Italy to determine the effectiveness of a cosmetic lotion containing caffeine to treat androgenetic alopecia. The sample the researcher used was 40 volunteers aged between 19 and 55 that were currently in stages 2-4 on the Hamilton-Norwood scale. All participants were instructed that for 4 months, they would massage this lotion in their hair for two minutes once a day. At the end of 4 months, there was a decrease in hair loss in 83 percent of the volunteers and an improvement of scalp conditions (dandruff, dryness) in 53 percent of the volunteers.

This idea of using caffeine to stop male pattern baldness is interesting due to its ability to “stimulate cellular metabolisms”, which can stop the shrinking of hair follicles. Also, caffeine penetrates hair follicles very quickly so results would show much quicker than other treatments.

Unfortunately, this study has a poor experimental design and not many other studies have shown promising results. For one, this study only has 40 participants. That is questionable whether that is enough people to be confident about extending the results to a bigger population. Also, there is not a control group. All 40 participants received the treatment so there is no baseline group to compare hair growth results. I would have been more convinced if half of the participants were given a placebo shampoo to see if they experienced similar subjective results to the caffeine group. Further, there is no way to know if the participants actually used the product once a day like they were supposed to since the participants were not under the researcher’s observation. Overall, much more could have been done by manipulating the explanatory variable, separating the participants into experimental groups, measuring the results more objectively, and using a more adequate sample size.

In another study conducted by Rachita Dhurat, it was found that microneedling (the act of puncturing the skin repeatedly with extremely small needles) might also be an effective alternative treatment for androgenetic alopecia by stimulating hair follicles. This was a case study that followed 4 men that originally showed no results from Finasteride of Minoxidil. Over the course of a 24-week period they received 15 treatments using microneedling. After 6 months, each patient saw new hair coverage that moved him or her up on the Hamilton-Norwood scale from 2 to 3 points. Also, 3 of the patients subjectively reported a 75 percent increase of thickness to hair while the fourth patient reported a 50 percent increase in hair thickness. Finally, all 4 patients maintained the same response from the treatment 18 months later. Look at the first patient’s results!

hair 1Hair 2

These results should be taken with a grain of salt. The sample size was only 4 people so there is no way to extend these results to the population. However, with the significant increases of hair seen in these 4 patients, more experiments with larger sample sizes should be conducted to validate Dhurat’s findings.

It should also be noted that all of the patients continued to use their original treatments of either Finasteride or Minoxidil during the experiment. This means finding a causal relationship between microneedling and hair regrowth is nearly impossible due to Finasteride and Minoxidil’s potential to be confounding variables. I would propose an experiment similar to this one with the use of microneedling techniques. However, with my experimental design, I would like to have a sample size that has no less than 30 people and a control group that doesn’t receive the microneedling treatment as a means of comparison. I would also make sure no patients were using Finasteride or Minoxidil so a more causal relationship could be established. I would measure by testing hair strength (maybe a pull test), and objective observations made by someone who is not the researcher, to control for the experimenter effect.

To conclude, male pattern baldness is a serious issue that affects men’s psychological health and self-esteem. Finasteride and Minoxidil are good treatments but their success rate is not much higher than 60 percent so continuous research must be done. Though this problem seems to be connected to DHT, eliminating it may not be the best answer. There may be other factors driving the relationship between DHT and hair loss that have yet to be discovered. So there are two options: Science must either further its research in treatments that better eliminate DHT, or start researching new ways and other mechanisms that can be responsible for male pattern baldness. Though it may seem insignificant compared to other issues in the world, we must not stray away from finding a cure for this phenomenon. With the persistence of the scientific method, there is potential for a 60 percent success rate to one day be a nearly 100 percent success rate this way, no man ever has to be stripped of his dignity.

Photo URLs

Photo 1

Photo 2

Photo 3

Photo 4

Stress: Love It or Hate It?

Three finals, four term papers and two group presentations. The average college student’s final few weeks of a semester tend to be associated with an overwhelming amount of stress. After talking with a few of my relatives over the holiday break, many told me, “Don’t stress. You’ll get sick and then you won’t do well on your assignments anyway.” This got me thinking. Is there any truth to the idea that stress suppresses one’s immune system?

It is tough to answer this question without first recognizing what stress is. Stress* has three components; there is a stimulus (stressor), a reaction in the brain from this stimulus, and a subsequent fight or flight response in the body.

Contrary to what many may think, stress is not all bad. There are two types of stress: acute stress (lasting a few hours) and chronic stress (lasting months). The question is, do these different types of stress affect your immune health the same way?

It all started with an observational study conducted by Janice K. Kiecolt-Glaser in 1984. She measured 75 first-year medical students from Ohio State University to see how the amount of “Natural Killer Cells” was affected by the stress of finals week. A natural killer cell is a lymphocyte, which is a type of white blood cell that makes up a human’s immune system. Kiecolt-Glaser found that this natural killer cell count decreased significantly during final examinations compared to a month before (where stress would be much lower). Since a low level of the natural killer cells indicated a weaker immune system, Kiecolt-Glasser saw a negative association between stress from final exams and students’ immune system function. So, as stress levels increased, the students’ immune systems functioned worse and worse.

There is not much to critique with this study. The researcher used an adequate sample size. The sample of 75 is greater than 30, which makes it large enough. Unfortunately, we do not have conclusive evidence that the stress of tests caused the decreased immune function since this was only an observational study. This also means that third confounding variables could have influenced the observed relationship. For example, finals weeks are usually bad weather times (freezing cold or high pollen), which could be the reason for the weaker immune systems. Another flaw I found in this study was the fact that it was a volunteer sample from one school. This creates bias and may make it hard to generalize results to the entire public. Nonetheless, this study has been the reason as to why many believe all stress is bad for one’s health.

As I said before, it turns out that some stress is not harmful. Actually, short-term stress is showing signs of being very helpful to human’s immune health. Firdaus Dhabhar conducted a study that showed how mice that experienced acute stress had an enhanced immune response. The hypothesis was that mice under acute stress would have an enhanced immune response to an adverse stimulus placed on their skin. There were two experimental groups: a stressed group and a “not stressed” group. The ‘not stressed’ group was the control group. To induce stress, he locked the mice in a mesh cage for two and a half hours.

The results were interesting. By the second day after introducing the stimulus to the mice’s skin, the stressed mice had a 60 percent increase to the area of skin, and the not stressed mice had a 30 percent increase. The more the affected area increased, the more immune system cells were arriving at the site. These results were consistent with the original hypotheses that stressed mice would show a “significant enhancement of the skin’s immune response.” Dhabhar also found the biological mechanism behind these results. It was something called gamma interferon, which regulates immune response and is vital to the enhanced effects on the immune system observed during times of acute stress.

So what do these findings mean in the real world? Basically, when we as humans are under short-term stress, our immune systems start to work harder to help us handle the stress. This, in turn, makes us less likely to get sick.

It could be easy to speculate with these results Dhabhar attained. Though it is not completely clear what the sample size for each specific group was, no group had a sample size greater than 9 mice. Also, I cannot find any similar research being replicated by other scientists. This would make me cautious accepting the results as they stand. I would like to see more studies and a meta-analysis of those studies to fully accept Dhabhar’s findings. Also, mice were used instead of humans. There is nothing that stands out that would have me question his use of mice, but another argument could be whether or not this theory extends to humans. I propose a similar experiment to be done but with humans instead. Instead of testing the effects of gamma interferon with immune response, I would be interested to see how an acute stressor affects a human’s immune response. It is probably not ethical to lower a human’s gamma interferon count so I would not initially test for it. I would instead focus on acute stress as a whole and its effect on the human immune system.

So what does this all mean? It means you may not want to listen to your relatives when they tell you all stress is bad. If you stress chronically, you may be at increased risks of becoming ill as Kiecolt-Glasser showed. However, if you stress a few hours before a big exam, or daunting lecture, you may just be increasing your odds of fighting off an attack to your immune system. The human body has a fight-or-flight response to stressful events for a reason. It is to help us. Not hurt us. It is not in your best interest to try to eliminate stress completely. Just keep it acute and not lasting months on end and you should not have to chalk your cold up to stress.


*If Stress article cannot be opened – https://umm.edu/health/medical/reports/articles/stress

Photo URLs:

Photo 1

Photo 2

Photo 3

Teeth Whitening: Sorting Through the Confusion

There are well over 100 teeth whitening products out on the market today. It is known that some of these products have produced fantastic results. It is also known that some products do virtually nothing. This is because the teeth whitening industry is not regulated by the federal government. In a world where there is a mix of confusion and uncertainty, doctors have tried to simplify the tooth whitening explanation as much as possible.

To start, though there are over 100 products on the market, doctors have been able to break them down into one of two categories. They are either a Peroxide-containing bleaching agent, or a whitening toothpaste (dentrifite). Where it gets confusing is the fact that these two categories have different subcategories as far as how the product can be delivered. Products range from gels, bleaching strips, lights, and even paint on materials. So should you go for peroxide, or just toothpaste?

If you want whiter teeth, the best idea would be to consult your professional dentist. Being that our government does not regulate the market, there are many products that give little to no results. Whitening toothpastes work but not to the extent most people believe they are working for them. At best, these toothpastes can remove immediate surface stains on teeth. They will not get rid of years of discoloration. The only guarantee is to have your doctor use a “tried and true” method of whitening. This would include products that have concentrations too high to ever receive over-the-counter. Most over-the-counter tooth whitening options are not great because they are not concentrated enough. This is due to the fact that they have to be safe on gums. In a doctor’s office, however, they can cover and protect your precious gums so they are not damaged, which also means they can use the higher concentration (more dangerous) whitening agents.

To conclude, if you are okay with just removing the surface stains or slightly improve your smile, home treatments that involve whitening strips or toothpaste may be the way to go. But, if you really want to take years off that aging, discolored smile, the only way is to see a dentist and go through a professional bleaching process. Doctors recommend you have your bleaching touched up once every 6 months, but acknowledge that most bleaching processes are effective for up to two years. So what are you waiting for? Skip the whitening toothpaste and go see your local dentist if you want beautiful, white teeth!

Running Versus Swimming

Many people who enjoy both swimming and running often face a tough choice. On any given day, they can go for a peaceful run, or they can cool off and still stay in shape in a pool. Especially at Penn State, where facilities for running and swimming are within walking distance, we have to be informed on which activity is best for what we are looking to accomplish. Choosing which activity you participate in should be based on whether your goal is to lose weight, loosen up your muscles, avoid joint pain, or even avoid some daunting chemicals.

To start, if your goal is to lose weight, the pool may not be the best option. Andrew Cate, a physiologist, noted in an article that there are several reasons why this may be the case. One of the issues is the fact that water makes individuals buoyant. Since water supports a person’s weight, it is easier to move. This means less energy is used to move which results in less calories burned. Also, in the water, it is easier to maintain your body temperature. Since you are not working as hard to keep yourself cool than you would on land, you are using less energy and again burning fewer calories. Finally, if you are not an experienced swimmer, it is nearly impossible to keep the cardiovascular intensity of the exercise as high as you could while running. This is because your muscles would fatigue much faster in the water than they would on land, keeping you from pushing your cardiovascular limits, which is key to weight loss.

If your goal is to exercise in order to combat arthritis, swimming is by far the better option. Swimming puts almost zero stress on your joints compared to running. This is because the water’s buoyancy supports the body’s weight. Without swimming, the cure for arthritis is a bit contradicting. Arthritis is treated by exercising regularly, which can increase strength, combat fatigue, and also reduce joint pain. It is hard to say an exercise such as walking or running reduces joint pain due to all of the added stress on one’s joints. This is where swimming is ideal. Swimming reaps the benefits of exercise without providing additional stress on the aching joints of someone who has arthritis.

While swimming can benefit those suffering from arthritis, it can also be detrimental to one’s health in other aspects. A study was recently conducted at The University of Cordoba in Spain with 49 participants (children and adults) looking at the presence of certain toxins in urine after one had swam or been around a pool with chlorine. They found that copious amounts of Haloacetic Acids (HAA) were present in the participants’ urine less than a half hour after they left the pool. HAAs are toxins known to be associated with cancer and even birth defects. Due to our skins ability to absorb water so quickly, and the chance of swallowing this water while swimming, humans are at a very high risk of putting this harmful toxin into their bodies. So if putting HAAs into your body does not scare you, especially when entering a pool that has been over chlorinated by mistake, then swim until your heart’s content.

To conclude, if your goal is to lose weight, run. If your goal is to treat sore joints, muscles, or arthritis, swim. And if your goal is to simply exercise under the most natural conditions, definitely run. This will ensure you are not exposed to any chemicals such as HAAs, which could possibly cause cancer down the line. The biggest thing to remember is that both running and swimming have their advantages and disadvantages. The best way to ensure you do not fall victim to any of the major disadvantages of either exercise is to have a variety of both in your normal routine. Maybe swim three days a week and run the other three days if at all possible. This will give you the best of both worlds.


Are Pitchers Safe?

On August 17th, 2015, Bryan Mitchell, a pitcher on the New York Yankees, became the seventh pitcher since 2013 to be hit in the head by a line drive from a hitter. Mitchell was fortunate not to have any serious injuries other than a slight nasal fracture. This is because the brim of his cap took most of the damage. But what about the pitchers hit before him that have not been so lucky? For example, when J.A. Happ was hit in the head in 2013, he suffered a skull fracture behind his left ear and a sore right knee from the impact of his fall.

Doug Fister of the Tigers tries to protect himself from a line drive.

A company called isoBLOX seems to have a solution. They have developed a baseball cap that provides frontal head protection and side head protection. The cap has been certified by the MLB to help protect against line drives up to 83 mph. Bruce Foster, the chief executive officer for isoBLOX’s parent company explained, “The padding is made of hexagon-shaped injection-molded polymers connected by a hinge, and fitted with a foam substrate.” This technology being used helps disperse the force of the ball when it impacts the cap. For the protection it provides, it only adds one half-inch thickness to the front of the cap and an inch on the sides. It also weighs seven ounces, which is only about 3 ounces heavier than a standard hat.

Alex Torres of the New York Mets

So why is Alex Torres of the Mets the only pitcher rocking this new technology? There are several factors. For one, many pitchers are superstitious and believe it will hinder their pitching performance. Unfortunately, this is not the worse reason. The main reason is that the “protective hat” only protects up to an 83 mph line drive. The company isoBLOX made some major faults in their statistical analyses when designing their cap.

To start, the MLB and isoBLOX set the threshold of the product at the average line drive speed from the data they collected. Since it is safe to say the speed of line drives is symmetrically distributed, this means the cap only protects against half of line drives hit. This also means that the half of line drives this hat is protecting against is the slower line drives. Line drives below the average line drive speed are more likely to be caught than those hit above the average speed since the pitcher has more reaction time. For example, a pitcher has twice as much time to react to a 50 mph hit than he does a 100 mph hit. Finally, the balls traveling below 83 mph have a far less change of producing a severe injury compared to the balls hit above 83 mph. The point of the cap is to protect against severe injury, therefor the threshold of the product should have been set at the max line drive speed hit, not the average.

If the MLB and isoBLOX can design a cap that has a higher threshold, and possibly reduce the bulk of the hat, I am confident Alex Torres would not be the only pitcher opting for the added protection. But as of now, from the data the MLB has collected, it seems the only thing Alex Torres’s cap is protecting against is the balls he is already likely to catch or knock down.

Is The MLB Boring?

When someone is asked whether or not they watch baseball, they most likely give one of two answers. They probably either say “yes”, or “no, it is too boring”. Many baseball-purists would cringe at such a remark but over time this point of view has become more and more popular. Is it true? Is the MLB too boring to watch nowadays? If your answer to that question is based on how many runs are being scored per game in recent years, your answer may just be correct.

In the last five years, the MLB has experienced many changes. There are more hard throwers coming through the ranks now than ever before, there has been a complete ban on performance enhancing drugs, and there is more shifting happening against teams. As pitching and defenses continue to evolve, batting has yet to have many advances in the last decade. This means that over the years, the odds have been stacked more and more against the hitter. This can be proven by the average amount of runs being scored per game. In 2014, the average amount of runs scored per game was 4.07. However, in 1925, the MLB hitters scored an average of 5.13 runs per game. Yes, this is just two years but if one were to make a scatterplot showing the year versus average runs scored per game, it would be easy to see the negative correlation. In order to make the game more interesting, maybe the MLB needs to figure out a solution to raise this statistic that continues to fall year after year.

When thinking of ways to raise this average runs per game statistic, a few ideas come to mind. The MLB could allow performance-enhancing drugs, but that probably is not in the best interest of the league. They could not allow teams to shift to a certain degree, but passing such a rule could result in strike from the teams and players. Or maybe the MLB can simply switch what kind of bat they allow the players to use.

As of now, the MLB only allows the players to use wooden bats. By switching to aluminum bats, the batted ball speed (the speed at which a baseball leaves a player’s bat after being contacted) would increase dramatically. This would lead to harder hit balls, which would result in more home runs, which would in turn result in more runs being scored per game.

Aluminum bats have been proven to outperform wooden bats in almost every testable area of a bat. Some of these areas that can be tested are bat speed, bat “sweet spot” size, and even bat compression.

To start, aluminum bats are hollow, while wooden bats are not. This allows for aluminum bats to have a center of mass closer to the barrel than that of wooden bats. The closer the center of mass is to the barrel, the lower moment of inertia the bat will possess, and thus be able to be swung faster. The faster a bat can be swung, the faster the batted ball speed will be. To put into simpler terms, if a batter is strong enough to swing a 26-ounce bat, he or she will be able to swing an aluminum version of that bat faster than a wooden version of that exact sized bat.

To continue, there has been no proof that the claim of aluminum bats having wider “sweet spots” is true. However, in Crisco and Greenwald’s study, they did find metal bats had a higher batted ball speed when the ball hit the aluminum bat outside of the “sweet spot” versus that of wooden bats. That can be shown by this graph here.

Finally, aluminum bats seem to have an elasticity property to them. When a ball contacts a wooden bat, the bat can compress up to half its original diameter, which can make the ball lose up to 75% of its initial energy. With aluminum bats, they have a “trampoline effect” and do not compress nearly as much. This means the amount of energy returned to the ball after it has been contacted is much greater in aluminum bats than in wooden bats. This phenomenon can allow for batted ball speeds 5 to 7 mph faster on average with aluminum bats versus wooden bats.

To conclude, this study produced by Crisco and Greenwald may not be conclusive in saying aluminum bats are definitely better than wooden bats, but it sure does make some eye opening discoveries. The other thing to keep in mind is that an increase in batted ball speed would lead to more runs scored, but it would also put the pitchers at a much higher risk of injury. It is reasonable to conclude that a pitcher would have a much higher chance of being severely injured if the hitter was using an aluminum bat instead of a wooden one. So should the MLB try to make the game more exciting? If you believe that answer is “Yes”, more conclusive evidence would have to be found for the MLB to ever consider switching bats. Maybe an experiment could be set up where a player had to switch what type of bat they used every other at bat over the course of an entire season. This would be a matched pairs design where factors such as bat size, weight, and player differences would all be controlled for. At the end of the season, statistics could be run measuring variables such as RBI’s, Hits, and Home Runs for each type of bat used.


Which Milk Is The Best?

Which milk should people drink? That is mainly a question over what you look to get out of your milk. Are you trying to build strong bones for later on down the road? Are you trying to save money? Or are you trying to lose weight? Most of these questions have sort of clear-cut answers. If you want stronger bones for when you begin to age, drink the milk with the most calcium. If you want to save money, buy whatever milk is on sale or cheapest at the time. If your goal is to lose weight, buy the milk that has the least amount of fat and calories per serving. Or maybe the obvious answer to this last question may is not the correct one. New studies are coming out with data that is quite paradoxical. These studies suggest that whole milk, which leads standard milk choices in the amount of fat per serving and calories per serving, is the best option for keeping people slim and lean.

Screen Shot 2015-09-16 at 11.12.44 PMScreen Shot 2015-09-16 at 11.12.55 PM

Multiple studies have shown a link between low-fat milk and obesity. One study, conducted by Dr. Mark DeBoer from The University of Virginia, measured 10,700 kids in the United States from the ages 2 to 4. The parents were asked questions regarding their child’s dairy consumption and questions relating to their BMI when the child was 2 and once again when they turned 4. The study found a correlation between weight gain and low-fat milks. A similar study conducted in 2005 by Brigham and Women’s Hospitals showed a relationship between skim milk consumption and weight gain in kids aged from 9 to 14. A third study, produced by the Scandinavian Journal of Primary Health Care, found that men aged between 40 and 60 years old who consumed whole milk and other dairy products high in fat, were less likely to become obese. Two surveys were given. One came in the beginning of the 12-year period, the other at the end of it. The questions asked had to do with what dairy products they consume, and their weight gain/lose over those 12 years. It was found that men who consumed non-fat or low-fat dairy products actually gained more weight over the 12-year period.

Since most studies done on this issue have been longitudinal, observational studies, it has been hard to link a direct cause to this phenomenon. Some believe milk with higher fat levels make people feel more full, so they are less likely to eat foods that could be higher in fat and calories. Another theory is that “There may be bioactive substances in the milk fat that may be altering our metabolism in a way that helps us utilize the fat and burn it for energy, rather than storing it in our bodies”. It could even be that the studies show no causal effect and the type of milk consumed has nothing to do with weight gain. Maybe it is reverse causation so people that are already fat feel they need to drink low-fat milk as a way to combat their obesity.

To try to eliminate so much doubt in the results obtained by these studies, an experiment would have to be done. Surveying people over a period of time may help find correlations, but it does not show any causal relationships. To do this, I would design a double blind experiment with 4 groups. One group would receive whole milk, one group would get 2%, another would get 1%, and the last group would receive skim milk. I would control for variables such as calorie intake of other foods, and exercise levels. After 24 weeks I would see if the overall groups’ BMI had increased, decreased, or stayed the same. From there I would have a better idea whether the fat content of the milk consumed had any effect on people’s weight.

Initial Blog Post

Hi everyone! My name is Greg Giliberti and I am a freshman majoring in Risk Management with the Actuarial Science option at the Smeal College of Business. I also plan to have a minor in Statistics. I am from Milford, Pennsylvania which is about an hour away from Scranton (yes, where The Office takes place).

I am doing this course to learn how to think more critically and insightfully, rather than just memorize facts about any particular science. My academic advisor assured me this class would be perfect to further my appreciation for science. She also warned me to stay away from “Weed-out” courses such as Chemistry since such classes are not required for my major. The reason I am not a science major is simply because I have always been more interested in math. I have never disliked or hated science. I just never loved it enough to make a career out of it.

Most of my posts on this blog will most likey tie into sports in some way since I am a huge sports fanatic. My favorite sports are baseball and football. One of my favorite shows happens to be Sports Science. Here is a picture from one of their episodes.

sports science

Also, something that has been in the news for months now is the issue of “Deflategate” and the accusation of the NFL New England Patriots under-inflating the footballs used in the AFC Championship Game. Here is a Video of some science behind whether it was even an advantage or not.