Category Archives: Results

Extra credit

extra_credit_2My use of extra credit has grown over the years, despite my concerns about grade inflation. I use it to

This year I really went crazy with it, in the end offering nine different routes to extra credit. I capped it at 10% so that extra credit does not dominate the grade, but within that constraint, a student can go for it as they wish. Much to my amazement, almost no students make anything close to full use of it. It is much easier to get 10% through extra credit than it is to get an extra 10% by doing better on the tests or blog.

I offered extra credit for:-

  1. Particularly lucid, stimulating, artistic or lateral blog posts (max 5%/post). This is to encourage/reward outstanding work. I thought few students did enough to deserve this, but it’s very good to have the option to reward those who go above and beyond.
  2. Suggesting exam questions. You have to really know your stuff to write exam questions. Just 5 students offered any up, even though I’d give them 2.5% for every question I used.
  3. Finding a mistake in an class test or an exam that causes me to regrade (max 5%/mistake). A couple of students suggested mistakes, but they were typos and so did not need regrading. Nonetheless, I think this extra credit is good because it emphasizes the possibility that Professors can be wrong, it gets hypervigilance going, and students who argue with me learn, even if they are wrong (especially if they are wrong?).
  4. Partaking properly in the first blog period (1%). This is an anti-procrastination (get-off-your-butt) carrot which I was trying for the first time. It did not work at all: only about 100 students participated properly, fewer than last year when no extra credit was available.
  5. Blogging ahead of deadline (2%/deadline). This was a time-management carrot. It too did not work.
  6. Surrendering phones in class (1%/time). This did work.
  7. Writing an extra blog (2%). I asked the students to write about something they learned in class and how it had or might change their life. Just  nine students took advantage of this. Maybe that mean the course had no impact on the 310 other students. But I thought all of the nine were really interesting, especially this and this and this and this.
  8. Opt in to names in the hat (1%). A little under a third of the class did this, which says something about students, but nonetheless, I liked this solution to the problem of cold-calling students in large classrooms.
  9. A bribe to get the SRTE return rate up (1%). I wasn’t going to use this bribe this year, but with just a few days to go, only 30% of the students had given feedback through the Student Rating of Teaching Effectiveness system. Since that 30% was for sure not going to be a random sample [as is clear from what appears on Rate My Professor], I offered the 1% extra credit to everyone in the class if the class return rate got about 80%. It hit 82.5%… I’ve agonized before about this shameless bribe, but I think we have to do it if we are going to take anything meaningful from the SRTEs.

On average, the class got 4.7% extra credit. That’s pretty amazing, given that 4% would happen more or less automatically (3 x 1% for the phone-ins + 1% for the SRTE bribe). Just 13 students got the maximum extra credit and only 34 got 8% or more. I am sure I had more students just ask for more grade.

Bottom line? There is an administrative cost to all this extra credit, and I was able to keep on top of it only because I have Monica supporting the course. Without that, I am not sure I would keep anything except #1-3 and #9. But otherwise, I think worth persisting for the bullet-pointed reasons I give above. For professorial peace of mind, buffers against students complaints and begging are not to be underestimated. More positively, carrots are at least in principle a good way to nudge student behavior, even if there is not much sign they actually worked on my students. Perhaps the time management/anti-procrastination carrots need to be bigger (#4, #5). Just how much do I need to bribe students to do what’s good for them?

What to make of this?

test-exam-grades-2016

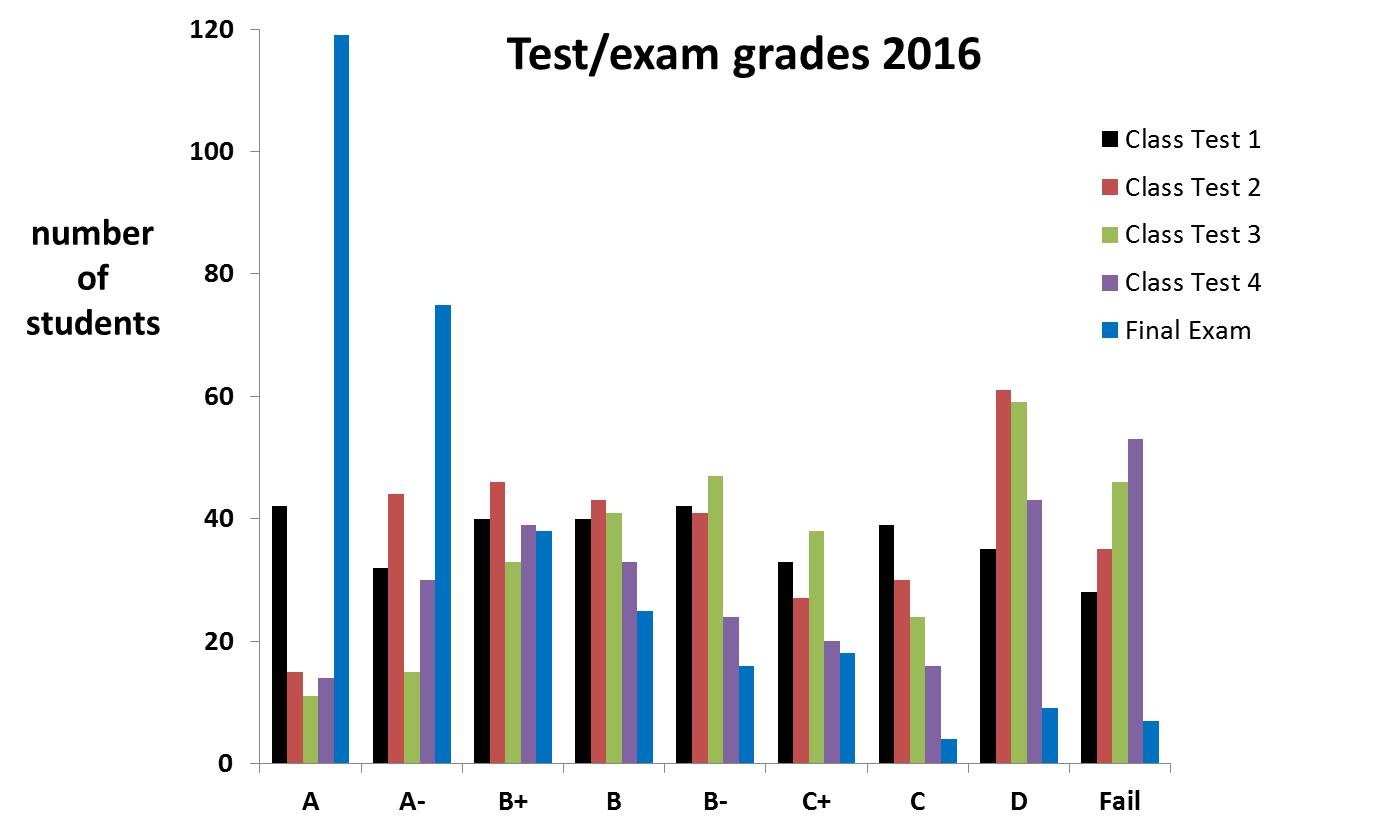
The class tests and final exam are all identical in format. In an ideal world, we should see grades improve steadily through the semester. We did last year.  That would look like a steady increase left to right for the A’s and a steady decrease left to right for the lower grades. We don’t really see that. Well, certainly not for the A’s. Maybe the B’s and C’s are doing sort of the right thing. A simpler interpretation is that not much happened at over the four class tests and then there was a huge jump in performance for the final exam.

When I first noticed how much better the class did in the final exam than in the class tests, I was pleased (they had learned something! there’ll be fewer complaints! etc etc). Then it started to gnaw at me. The final exam is open, on-line for five whole days (120 hours) and, like the class tests, the students get a second go at the exam, having learned what their score was first time around (but not which questions they got wrong). Could there be widespread cheating? Now this is not something nice to think about, far less discover (just think of the time-suck it would be to run large chunks of the class though academic integrity proceedings). But I decided I should anyway take a look.

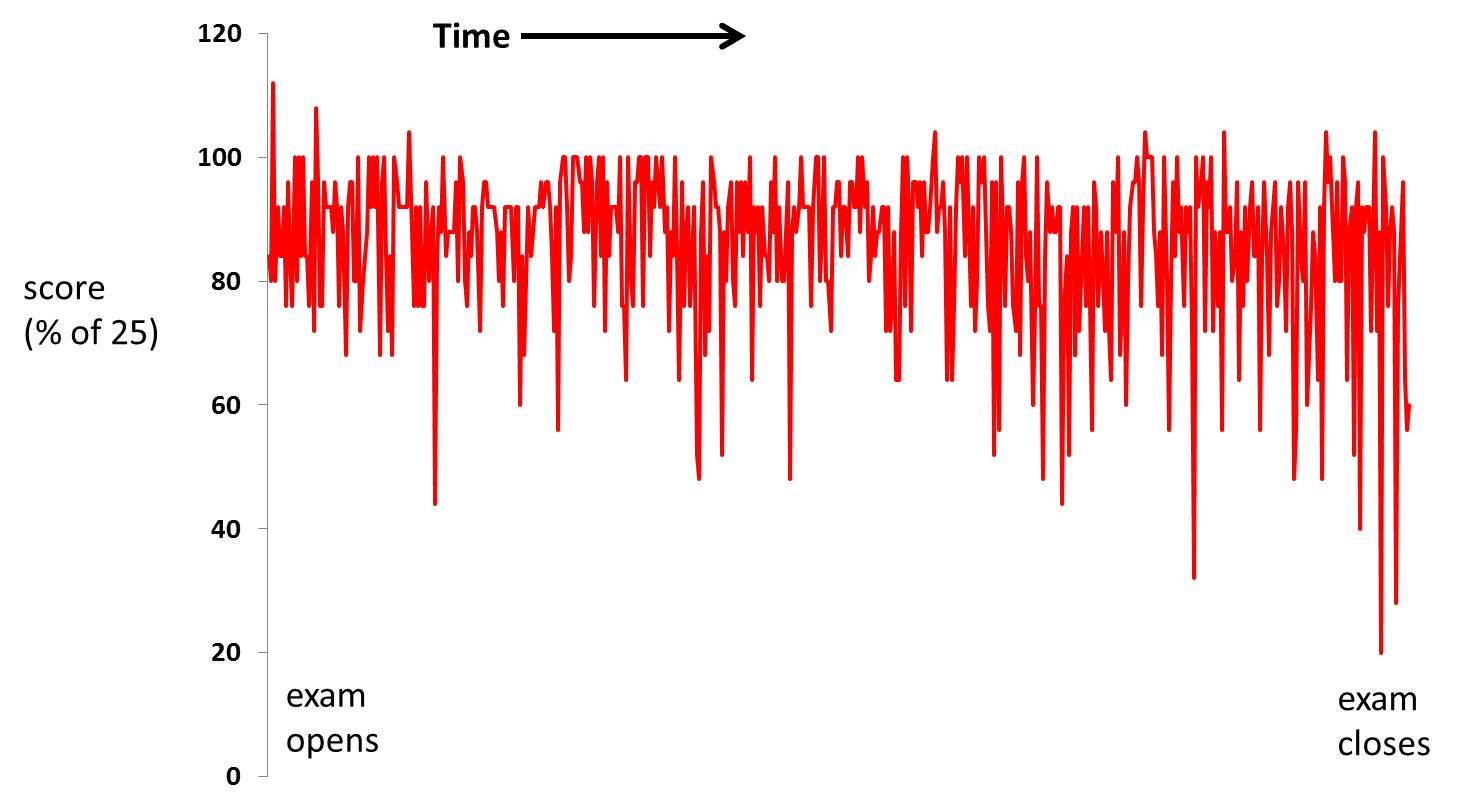
The set-up is vulnerable to a class that gets really organized and uses their first exam attempts to try to work out the correct answers. That would take some serious amount of class-wide coordination to pull off. But let’s imagine what that would look like if it happened. Most obviously, test performance should improve over the five days the test is open. There is no sign of that. In fact, if anything overall performance gets worse through time (I believe that’s because procrastinators do worse on average).

testing

Each point is a test score; students get two goes so there are about 600 scores here. I ask 28 questions and grade out of 25; that’s the plotted score. More than 100% is therefore possible (note the two times that happened, it was me, once to test the test and once to test what Angel does when you get something wrong).

This picture doesn’t rule out some types of cheating (e.g. the highly illegal business of getting someone else to do the test for you), but I think it does rule out most plausible scenarios of large-scale class-wide fraud.  So I guess the simplest explanation for the performance jump in the final exam is some combination of (a) me setting an easier exam, and (b) students having more time and motivation to do well.

The way to be 100% sure about this would be to do the exam proctored in the exam center. What a performance for a class on this scale — plus, some students would miss it and need a re-take test. That would be all so tedious.

2016: the bottom line

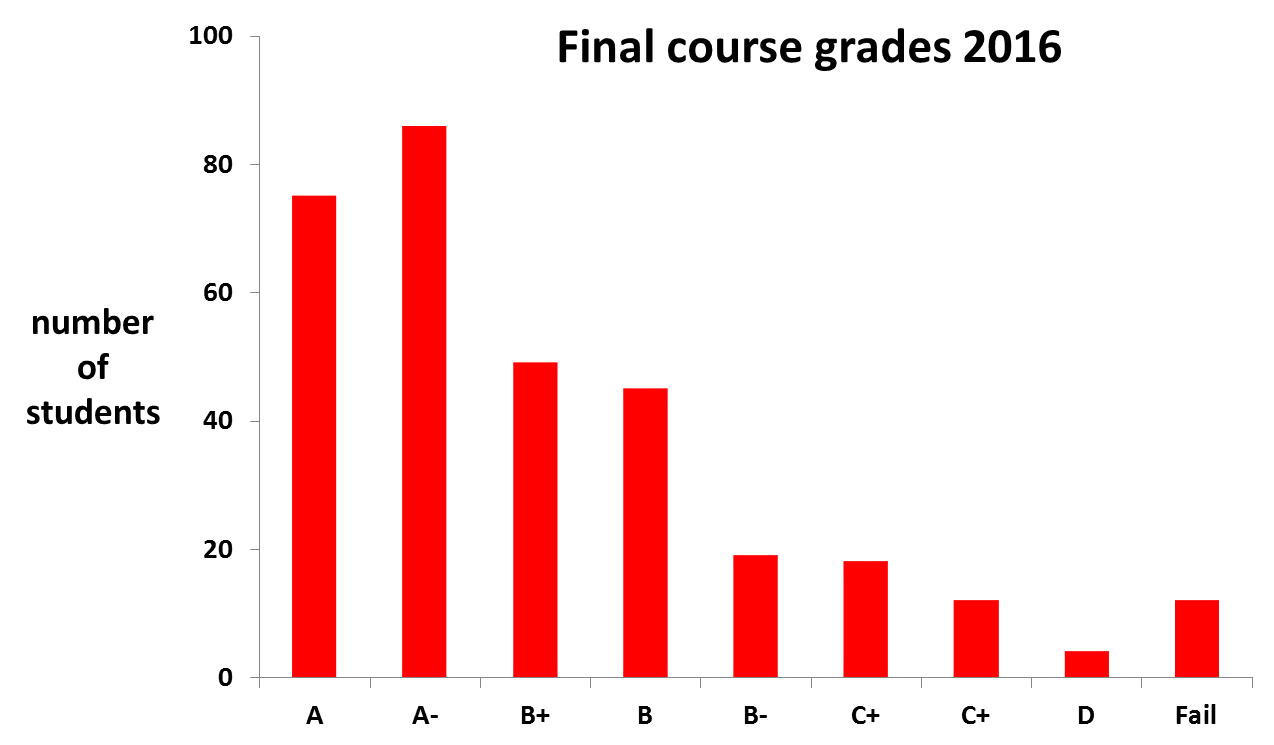
I calculated the final grades almost a week ago and then let them sit on Angel until now. This is to give the students a chance to complain. That generates a bit of e-traffic but very effectively crowd sources the search for errors in my grade book. With 300+ eagle eyes on it, I am now confident there weren’t any. So the grades are officially posted today. They look like this:

grades-2016

The class average is 87.6% (B+), or 89.6% (B+) for those who passed. We started with 358 students; we ended with 317. Among the finishers, 50% got some type of A, 66% got a B+ or better and 80% got a B or better. With extra credit, 11 students got >100%. Altogether rather similar to last year.

I say it every year, so I guess I’ll say it again: what to make of this grade distribution? Is it about right or too high or too low? We had a Biology faculty meeting a while back, that I sadly missed (not often I say that), where the proportion of A’s was being discussed. In biology classes for 2013 with more than 20 students, the numbers looked like this:

% A and A- 100-200 level Bio Courses 400-level Biol Courses
Mean 24% 42%
Median 27% 36%
Range 13-39% 13-99%

Everybody except the person awarding 100% A’s thought 100% was too generous. The minutes from the meeting helpfully say: “Faculty Senate policy allows faculty to grade according to their best judgement. Although programs can provide guidelines, ultimately grades are at the discretion of the individual faculty member. Several faculty shared their experience of figuring out their grading criteria with little to no guidance. It was widely agreed that some departmental guidelines for grading would be helpful.” No such guidance has been forthcoming because I don’t think any such guidance is possible. It’s a fundamentally challenging problem. The problem is even more difficult for Gen Ed courses where there are no professional discipline-specific views on relevant standards (and how can there be?).

Is 24% about right? My grade distribution with its 50% of A’s is clearly out of line with the 100-200 level Bio courses. Does that matter? People get excessively steamed up about grade inflation, but if we worry about that from data on the proportion of A’s, it implies that the only thing that matters is relative success. And if that’s important, our job is to not what I think it is, but instead it is to identify and anoint the top x% of students.  Which is CRAZY.

Actually, thinking about this too hard might drive me crazy. Previous ruminations are here and here. I am making no mental progress on this problem at all. Worse, I don’t see anyone else even engaged with it. In the shower this morning, I had a thought: isn’t the search for an ideal grade distribution fundamentally silly? What I should care about is the impact I am making to the way students think about the world. The grades might say something about that. But probably not much. So, Andrew, think about what’s important, not what is easily measured. Ruminate on that.

The line in the sand

It’s that time of year where I get inundated by email with students asking for a better grade. These requests fall into two categories.

  1. They’d just like some more. My 2015 response to that is here.
  2.  They’d like to be rounded up. My 2015 explanation of my rounding algorithm is here.

To both those 2015 posts, I note that this year there was up to 10% extra credit available. Students who want a higher grade might think about why they did not make full use of that.

Moreover, all students got at least 1% extra credit (the bribe to get the class SRTE rate return rate above 80%, which it duly was), and many students got more as carrots for time management, phone hand-ins, names in the hat….  That means all students just below a grade boundary got as close as they did because of extra credit — not academic performance. If I took away the non-academic extra credit, they would not be close. Grades are earned not requested.

line-in-the-sand

Final Exam

I am always pleasantly surprised how well students do on the final exam. This time, the average was 88% (B+) (89% (B+) when the fails are excluded). That’s a full 15% better than Class Test 4. There were 7 fails and 5 no-shows. No students got everything right, but on my ask-28-questions-grade-out-of-25 algorithm, 64 students got 100%, and six students got 26/28. There were 119 A‘s, 75 A-, 38 B+, 25 B, 16 B-, 18 C+, 4 C, and 9 D‘s.

Once I have dealt with the final grades, and the e-correspondence they generate (“please sir, can I have some more grade”), I’ll might come back and muse some on why the final exam performance is so much better than in the class test which was just a few days earlier (a 15% jump in average performance — from a C to a B+ — in just five days?)

Overall blog grades

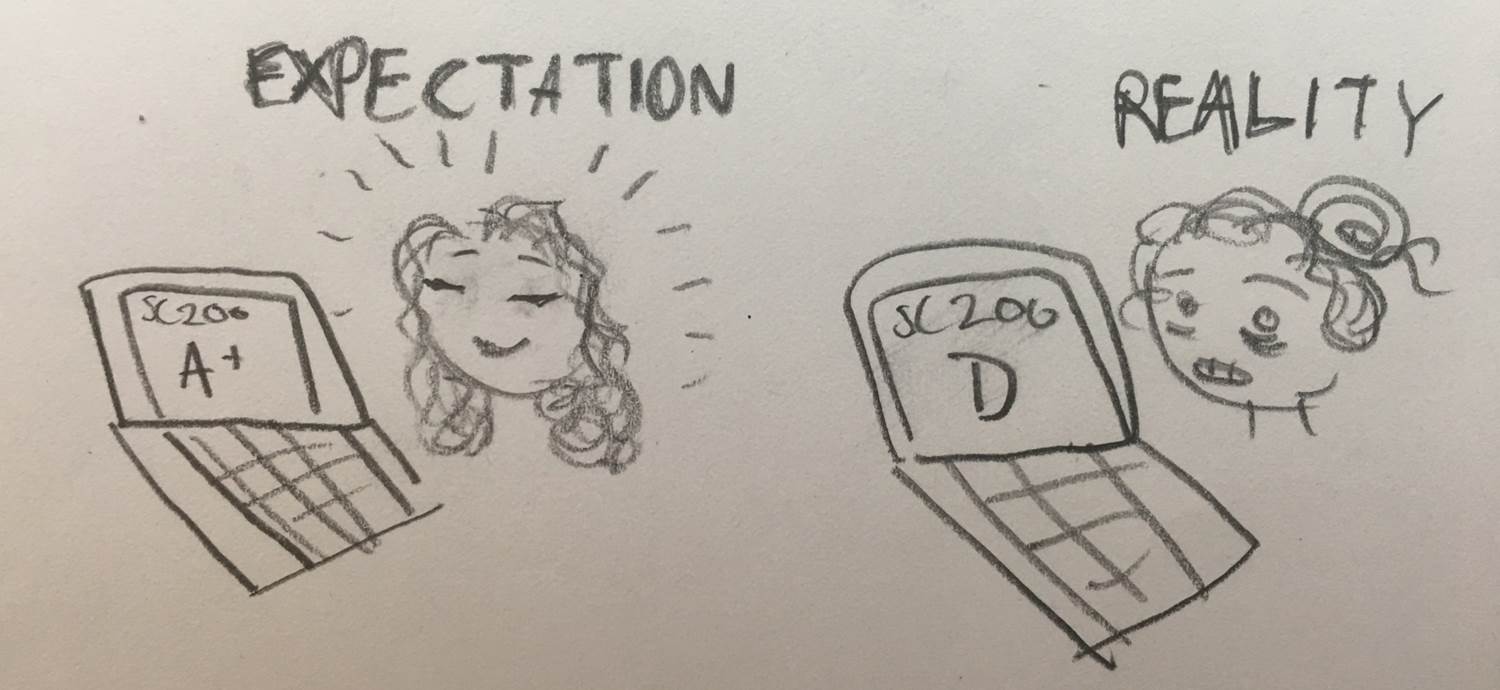
This terrific cartoon appeared as a response to a questionnaire I gave the students on the lessons they learned from SC200 on how best they could improve their learning and their grade

This terrific cartoon appeared last week on a class questionnaire….

There are three blog periods during the semester; at the end of each, students get a grade and personalized feedback on their work. I take the best grade from the three periods. This algorithm encourages improvement, mostly lifts games and sometimes delivers brutal lessons in time management.

The final blog grades were: A, 9; A-, 29; B+, 27; B, 42; B-, 41; C+, 66; C, 45; and D, 35. Incredibly, 20 students failed to do enough work to pass. A further five students did nothing at all. Ever.

So about 10% of the class achieved some kind of A. That seems about right to me. I wonder why that feels about right. I said the same thing when 33% of the class got some type of A on the class test final grade. We professors are left to set the bar where we want (unless its a subject with a long history like math, where there seems to be agreement [how?] or where some professional body stipulates authoritative standards [derived from….?]). This means the height of the bar becomes a great source of tension, and one which is completely ignored by university authorities because it’s a really tough problem. I set the bar where I feel good about it. I think we want to stretch the students without discouraging them. I have untenured colleagues who low-ball it so students are attracted to their classes so they can keep their job. I wish I could wrap my head around an incentive structure that results in faculty job security as the primary determinant of student performance. Sadly for my disgruntled students, I have tenure and so am free to determine my expectations of students. Mine come from a very different source and a firm belief that because this stuff matters, it’s better if things are challenging. At least one student agrees:

Another..

Blog Period 3 results

Well, we made it. The blog is done.

gradesBlog Period 3 results: We had 167 no-shows, over half the class. A further 34 didn’t do enough to pass. Among those who did, the average was 77.3% (C+). Under my best-of-three-blog-periods grade algorithm, it is always a little hard to know what to make of the grades for the third and final period. The students who participate include those trying to improve their grades from previous blog periods. They are typically going for gold. And then there are a ton of students who are participating for the first time, so they have not had any feedback on previous work and worse, being procrastinators, many of them leave it till the end of the period before they start doing anything. We had some shamefully bad first attempts just hours before the deadline. Sigh.

Still, there were some posts I really enjoyed. Students unhappy with their grade (or indeed other things), might try forcing a smile. Much to my surprise, birth control provides fertile (groan) grounds for a discussion of confirmation bias, and reading real paper might be better than reading screens if you want to learn stuff. And if you are germ phobic, it’s better to touch the toilet than anything else in a public bathroom. A post on zombies contained material I had not known of — and used in class. There is also a great post about a hugely important topic: that your health might be massively affected by your social status. I think that will become one of the biggest issues in employment law one day. Workplace health and safety was once ignored; now it’s literally top of the agenda. But almost no one gets hurt by the stuff that involves. Instead, people get hurt if they are not fairly promoted. On a more cheerful note, I enjoyed learning about grocery store hunger and there was a nice discussion of what seems like obvious nonsense to me: a device you pour your wine through which allegedly stops hangovers. Sign me up for a randomized control trial of that. Though not if I have to pay $80 for the damn thing. As Valerie pointed out, you can buy several bottles of wine for that.

You can buy ten times more wine for $800. That’s the scale of the bill I was sent for my last annual medical check up. There was nothing wrong with me before I went and nothing after. But there was a lot wrong with the doctor who ordered a whole lot of tests my insurance company did not think I needed and even more wrong with the ever exasperating Mt Nittany Health who simply can not do billing properly. So I much enjoyed a post summarizing the evidence that annual check-ups are a waste of time when you’re well (the idea that healthy people need them is a myth put about by physicians). Michael even explains how to get a check-up for free. I wonder how many tests I would set if I got money each time a student took a test. And how high blog scores would be if I got paid each time I awarded an A. But I don’t. So:

The overall grade distribution was: A, 2; A-, 10; B+, 8; B, 11; B-, 21; C+, 24; C, 15; D, 27; Fail, 34.

Where we currently stand

With the final blog period, the final exam and some extra credit to be added, we have six students on more than 100% for their final grade, and about 85 with some kind of A. Conversely, we have about 40 on a fail. The final blog grade should save many of those.

Class Test Score Overall

Bummed out by the Class Test 4 scores, I decided to have a quick look at the overall score for the class tests (I take the best 2 of 4). This usually cheers me up. And indeed it did. The distribution is: A, 21; A-, 81; B+, 36; B, 68; B-, 35; C+, 24; C, 29, D, 12; Fails, 9.

So about a third of the class are on some type of A. That seems about right to me.enhanced-5890-1412873873-5


I wonder why that feels about right. There are no guidelines on this whatsoever. We professors set the bar as high as we want. How high to set the bar is the hardest problem in Higher Education and everyone avoids it like the plague. I suppose the reason it cheers me up to have a third of my students on an A is that no individual test turned up that many A’s. My take-the-top-two-test-grades-of-four algorithm allows improvement and fluctuating performance. So I get to challenge the students and many get well rewarded. No trade-off.

Another observation: four students got a overall class test score of 100%. None of those got 100% in all four tests. I think that is good. Even those attaining the very highest scores still have something to reach for. I feel better about that too.