 As a time management carrot, I gave 1% extra credit for doing blogs five days early. This is extra credit for no extra work.
The proportion of students who took advantage of this freebie?
Blog Period 1: 12%
Blog Period 2: 7%
Blog Period 3: 7%

As a time management carrot, I gave 1% extra credit for doing blogs five days early. This is extra credit for no extra work.
The proportion of students who took advantage of this freebie?
Blog Period 1: 12%
Blog Period 2: 7%
Blog Period 3: 7%
 In my final class, I drew the students’ attention to this really excellent example of how to rationally think about evidence and reach a conclusion. I hope all SC200 graduates are now capable of assembling relevant data and thinking about it the way this author does.
I like his discussion because it leads him to a conclusion opposite to that reached by the Federal Government (CDC) and by the American Academy of Pediatrics, a professional body that should know a thing or two. I have no strong opinion on the author’s conclusion, but I sure do like his reasoning process.
I raised this particular topic because the majority of students will face this uniquely delicate decision in their not-too-distant future. As with so many decisions, they can take the easy route and accept the first bit of advice they hear from an authority figure like their mom, minister, medic or some moronic website — or they can think about it critically themselves. I really hope I empowered them to do that.
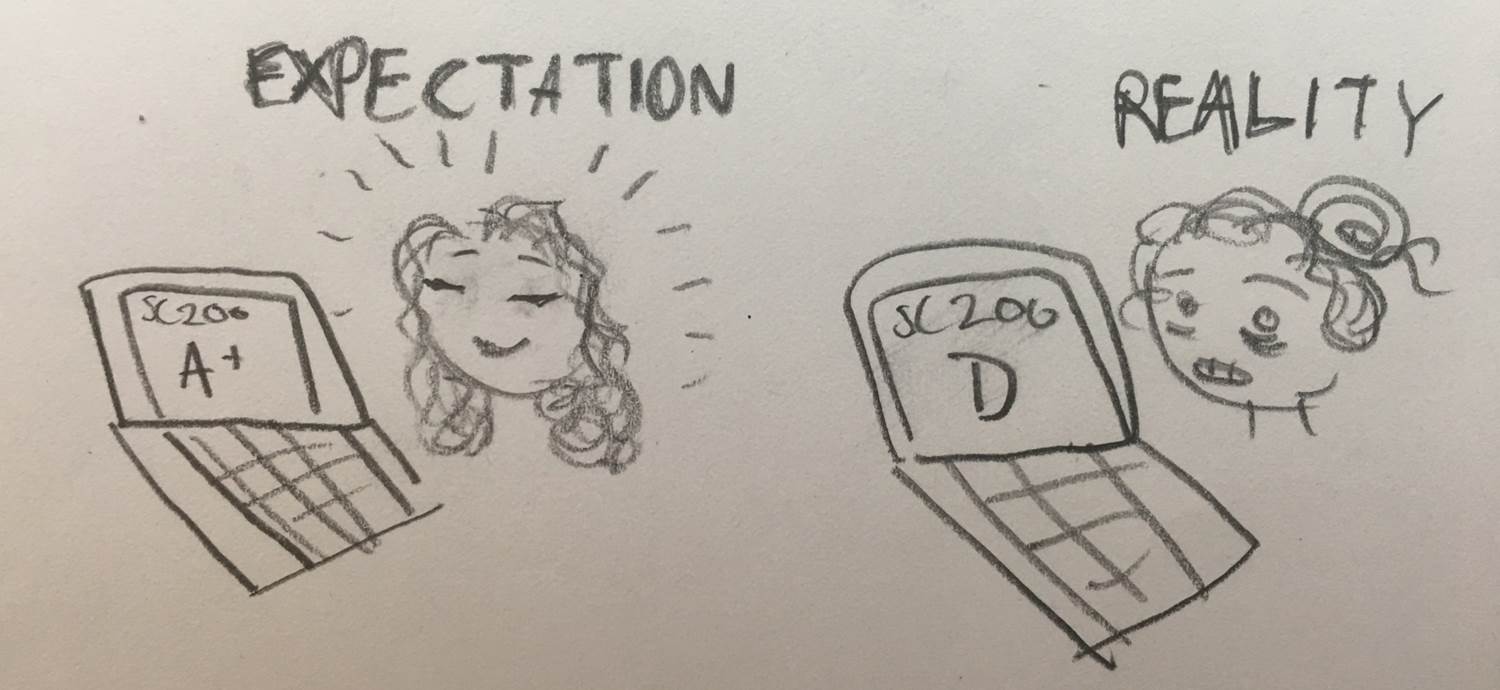
This terrific cartoon appeared last week on a class questionnaire….
There are three blog periods during the semester; at the end of each, students get a grade and personalized feedback on their work. I take the best grade from the three periods. This algorithm encourages improvement, mostly lifts games and sometimes delivers brutal lessons in time management.
The final blog grades were: A, 9; A-, 29; B+, 27; B, 42; B-, 41; C+, 66; C, 45; and D, 35. Incredibly, 20 students failed to do enough work to pass. A further five students did nothing at all. Ever.
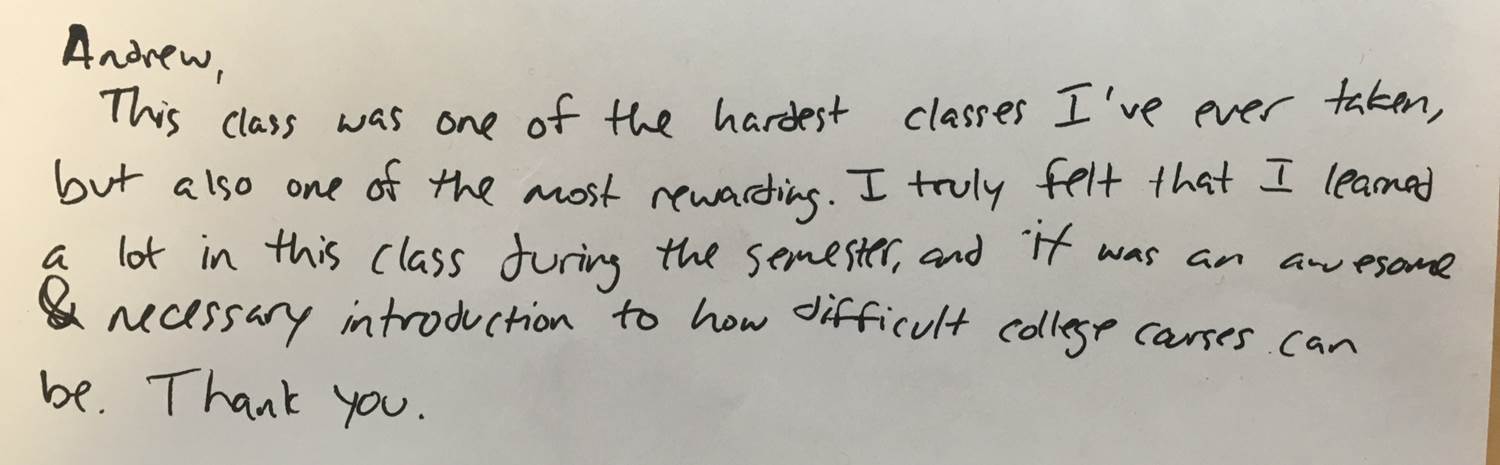
So about 10% of the class achieved some kind of A. That seems about right to me. I wonder why that feels about right. I said the same thing when 33% of the class got some type of A on the class test final grade. We professors are left to set the bar where we want (unless its a subject with a long history like math, where there seems to be agreement [how?] or where some professional body stipulates authoritative standards [derived from….?]). This means the height of the bar becomes a great source of tension, and one which is completely ignored by university authorities because it’s a really tough problem. I set the bar where I feel good about it. I think we want to stretch the students without discouraging them. I have untenured colleagues who low-ball it so students are attracted to their classes so they can keep their job. I wish I could wrap my head around an incentive structure that results in faculty job security as the primary determinant of student performance. Sadly for my disgruntled students, I have tenure and so am free to determine my expectations of students. Mine come from a very different source and a firm belief that because this stuff matters, it’s better if things are challenging. At least one student agrees:
Well, we made it. The blog is done.
 Blog Period 3 results: We had 167 no-shows, over half the class. A further 34 didn’t do enough to pass. Among those who did, the average was 77.3% (C+). Under my best-of-three-blog-periods grade algorithm, it is always a little hard to know what to make of the grades for the third and final period. The students who participate include those trying to improve their grades from previous blog periods. They are typically going for gold. And then there are a ton of students who are participating for the first time, so they have not had any feedback on previous work and worse, being procrastinators, many of them leave it till the end of the period before they start doing anything. We had some shamefully bad first attempts just hours before the deadline. Sigh.
Still, there were some posts I really enjoyed. Students unhappy with their grade (or indeed other things), might try forcing a smile. Much to my surprise, birth control provides fertile (groan) grounds for a discussion of confirmation bias, and reading real paper might be better than reading screens if you want to learn stuff. And if you are germ phobic, it’s better to touch the toilet than anything else in a public bathroom. A post on zombies contained material I had not known of — and used in class. There is also a great post about a hugely important topic: that your health might be massively affected by your social status. I think that will become one of the biggest issues in employment law one day. Workplace health and safety was once ignored; now it’s literally top of the agenda. But almost no one gets hurt by the stuff that involves. Instead, people get hurt if they are not fairly promoted. On a more cheerful note, I enjoyed learning about grocery store hunger and there was a nice discussion of what seems like obvious nonsense to me: a device you pour your wine through which allegedly stops hangovers. Sign me up for a randomized control trial of that. Though not if I have to pay $80 for the damn thing. As Valerie pointed out, you can buy several bottles of wine for that.
You can buy ten times more wine for $800. That’s the scale of the bill I was sent for my last annual medical check up. There was nothing wrong with me before I went and nothing after. But there was a lot wrong with the doctor who ordered a whole lot of tests my insurance company did not think I needed and even more wrong with the ever exasperating Mt Nittany Health who simply can not do billing properly. So I much enjoyed a post summarizing the evidence that annual check-ups are a waste of time when you’re well (the idea that healthy people need them is a myth put about by physicians). Michael even explains how to get a check-up for free. I wonder how many tests I would set if I got money each time a student took a test. And how high blog scores would be if I got paid each time I awarded an A. But I don’t. So:
The overall grade distribution was: A, 2; A-, 10; B+, 8; B, 11; B-, 21; C+, 24; C, 15; D, 27; Fail, 34.
“What do we hope to accomplish?” asks Stuart Firestein in his interesting 2016 book Failure. I like his answer:
“Science has for the past four or so centuries provided more and better explanations about nature than anything in previous recorded history. Mostly it developed a strategy for finding stuff out and knowing whether to believe it or not.”
As he says later in the book: “Science is the best method I know for being wary without being paranoid.”
With the final blog period, the final exam and some extra credit to be added, we have six students on more than 100% for their final grade, and about 85 with some kind of A. Conversely, we have about 40 on a fail. The final blog grade should save many of those.
Bummed out by the Class Test 4 scores, I decided to have a quick look at the overall score for the class tests (I take the best 2 of 4). This usually cheers me up. And indeed it did. The distribution is: A, 21; A-, 81; B+, 36; B, 68; B-, 35; C+, 24; C, 29, D, 12; Fails, 9.
So about a third of the class are on some type of A. That seems about right to me.
I wonder why that feels about right. There are no guidelines on this whatsoever. We professors set the bar as high as we want. How high to set the bar is the hardest problem in Higher Education and everyone avoids it like the plague. I suppose the reason it cheers me up to have a third of my students on an A is that no individual test turned up that many A’s. My take-the-top-two-test-grades-of-four algorithm allows improvement and fluctuating performance. So I get to challenge the students and many get well rewarded. No trade-off.
Another observation: four students got a overall class test score of 100%. None of those got 100% in all four tests. I think that is good. Even those attaining the very highest scores still have something to reach for. I feel better about that too.
 The results from the 3rd Class Test were the most disappointing I’ve ever seen. Yesterday was Class Test 4 and the results are only a shade better. Among those who took the test, exactly the same class average as Test 3, 74% (C). But that average comes from way more A’s and A-‘s (44, up from 26 last time), fewer B’s, C’s and D’s (good) but more dreadful fails. Oddly, we also had way more no-shows (53, up from 19 last time). So the best we can say is that the decline in test performance across the semester has been arrested. The average grade among those who passed was 80% (B-).
Two students got 100% on my ask-28-questions-grade-out-of-25 algorithm, but the highest score was 25/28. The rest: A, 14; A-, 30; B+, 39; B, 33; B- 24; C+, 20; C, 16; D 43; Fail, 53.
When I look at the performance on the individual questions, there were what I would term under “performance problems” with the questions involving stuff I’d gone over in class in the most recent weeks. Perhaps that’s a consequence of the low attendance:
Most heart breaking:
Which of the following is currently an open question in science?
(a) the nature of dark energy
(b) the safety of childhood vaccines
(c) the cause of climate change
(d) the chemical composition of celestial bodies
(e) all of the above.
A staggering 55% of the class chose (e), meaning that I failed to get across the strong scientific consensus on (b) and (c), and many were not paying attention to Jason Wright’s strong guest performance when he showed we learned how to do (d) in 1859. I weep.
Just one question seems important for me to go over in class today. That’s one which makes clear I have not made clear enough that statistical significance per se tells you little about how big an effect is. Statistical significance does not necessarily mean biological significance.
I polled the class on which of topics they would like me to cover in the remaining classes. This gave me a popularity ranking on the options I offered, from most to least popular (n=141 respondents):
 Are there aliens? (91%)
This order is the complete reverse of what is interesting to me and (I believe) the vast majority of scientists. Go figure.

This is the actual hat…
According to a comment in this very interesting video about how to get large classes engaged in active learning, males are more likely to put their hand up and to be called on in class. Best practice is therefore to do random cold calls. Students hate that, and so I compromise: for extra credit, they can have their names in a hat from which I randomly select people.
The class is 44% male. 40% of those who opted to have their names in a hat were male. So no bias there. The real bias is probably in the personality types selected. That sort of bias might be much more insidious.