In this tutorial, we are going to use the Altoona combined dataset to get additional insights by creating new columns, and then focus on those insights by hiding some old columns (in RapidMiner you can remove columns, Tableau only hides them).
We are asking the following questions:
- What is Altoona’s crime rate, and has it really increased over the period, or not?
- Looking at the proportion of different racial and ethnic groups in Altoona’s population, are any groups significantly overrepresented, or underrepresented in recorded crimes?
Step 1: Create new columns
We start by opening the “Altoona Combined Data.tde”. This is a familiar view:
- Rename the dataset from “Altoona Combined Data Extract” to “Altoona Combined Data”, to keep the name simple and intuitive.
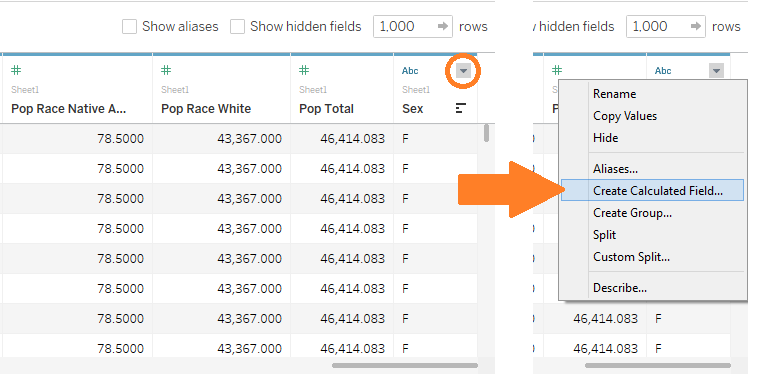
- To create new columns, scroll right to the last current column in the table, right-click on the last
column’s header, and in the drop-down menu select “Create Calculated Field…”
- A new windows pops up – this is where you create a new column:
Type % Crimes by Black in the title box, and type [Adult Race Black]/[Adult Total] in the calculation space. You will notice that as you write the formula, Tableau automatically recognizes which existing columns you are using to create the new column!
- When you are done typing, press OK – the new column is created:
- Use the same steps to create the following 4 new columns:
% Pop Black, calculated as [Pop Race Black]/[ Pop Total]
% Crimes by White, calculated as [Adult Race White]/[Adult Total]
% Pop White, calculated as [Pop Race White]/[Pop Total]
% Crimes in Population, calculated as [Adult Total]/[Pop Total]
Step 2: Use new columns to create even newer columns
The data grid shows all 5 newly created columns, alongside the original columns:
- The newly created columns do not have a blue line above
them, thereby indicating that they did not come directly from the dataset. - The newly created columns are also distinguished by the symbol
 , and text under the symbol saying “Calculation”.
We now use these newly created columns to create even newer columns for our purpose:
- Right-click on % Pop Black, in the drop-down menu select “Create Calculated Field…”, and when the new window pops up, create new column Diff Black, which is calculated as [% Crimes by Black]-[%
Pop Black] – note that our newly created columns (e.g. % Crimes by Black) are now used to
create even newer columns!
Once created, you can see Diff Black just next to % Pop
Black:
- Repeat the above step to create new column Diff White, calculated as [% Crimes by White]-[% Pop White].
Step 3: Hide older, unnecessary columns
We have successfully created all necessary new columns. They can be seen in 2 main places:
- on the data source page in the data grid, and
- in the worksheet in the Data pane:
We can further focus on the new columns by hiding old, unnecessary
columns.
1. You can hide columns straight in the Data pane – just right-click on a column, and in the drop-down
menu select “Hide” – e.g. do this for Adult Ethnic Hispanic:
2. Alternatively, you can hide columns in the data grid on the data source page – similarly to above, just right-click on a column’s header, and in the drop-down menu select “Hide” – e.g. do this for Sex:
3. For our purposes, it seems a bit faster to hide columns using the first approach in the Data pane,
so let’s do that – select all variables except DimensionMonth, and Measures % Crimes in
Population, Diff Black, and Diff White (you can select multiple variables by holding down CTRL key on the keyboard while selecting them), and hide all those other variables:
If you ever need to unhide any columns that is easy – just go to the data source page, and on top of the data grid check “Show hidden fields”:
Once all columns are showing, you can select any number of them, right-click, and in the drop-down menu select “Unhide” to reverse hiding.
Review
This Module showed how to create new columns from your data,
and how to hide old columns:
- To create new columns, right-click on any column, and in the
drop-down menu choose “Create a calculated field…” - To hide old columns, right-click on any column, and in the drop-down menu choose “Hide”.
- To unhide columns, in the data grid check “Show hidden fields”, and then select for “Unhide” those columns you want to unhide.
Important: if you need to use an old column in calculation for a new column, the old column must be unhidden!
Challenges:
Practice what you just learned by answering the following questions. Answer each question in a new worksheet.
- What is Altoona’s crime rate (range), and has it really increased over the period, or not? Hint: use the newly created variable % Crimes in Population.
- Looking at the proportion of black and white racial groups in Altoona’s population, are they significantly overrepresented, or underrepresented in recorded crimes over time? Hint: use the newly created variables Diff Black, and Diff White. Visualize them together on the same graph (blended axis) the way we did in Module 3. If a Diff variable is greater than zero, that means that the group’s proportion in crimes is larger than the group’s proportion in population, i.e. the group is overrepresented in recorded crimes.
- Looking instead at the proportion of Hispanic and non-Hispanic ethnic groups, do we see a similar pattern of over- and underrepresentation as with black and white race? Hint: repeat steps in Module but instead of race, use ethnic groups in creating new variables.
Next Page: Previous Page:


