Lingjie Zhou
Abstract
In this post, the band structure is calculated for two phases of WTe2. The effect of spin-orbital coupling(SOC) on the band structure is checked and when the SOC is turned on, there is a gap opening at the band touching point.
Introduction
Tungsten ditelluride(WTe2) has two different phases. Shown in figure 1, the 1T phase has the hexagonal structure while the 1T’ phase comes from the lattice distortion from the 1T phase. Although the structures are differed only by distortion, the 1T WTe2 is a normal semimetal but the 1T’ WTe2 is predicted to have nontrivial topological properties such as quantum spin Hall effect. This material has sparked intense research as it is a two-dimensional material and can be easily exfoliated[4]. In this post, we used plane-wave basis sets with norm-conserving pseudopotentials to perform DFT methods to calculate the band structure and density of states(DOS) for the 1T and 1T’ WTe2.
Method
The CASTEP[1] package is used to carry out the DFT calculations. The exchange and correlation functional we used is the Perdew, Burke and Ernzerhof(PBE) functional described within the generalized gradient approximation(GGA) [2]. The ‘on the fly’ generated norm conserving pseudopotential for Te was generated with 6 electrons in the valence panel with (5s2 5p4) and for W was generated with 14 electrons in the valence panel with (5s2 5p6 5d4 6s2) as the electronic configuration. The self-consistent-field tolerance of the calculated energy is 2^-6 eV and the maximum self-consistent-field tolerance cycle is 100. The monolayer structure is created with 15 A vacuum slab.
k point Convergence
The convergence of k point is checked on the geometrically optimized 1T and 1T’ WTe2 monolayer structure with 15A vacuum slab. The Ecut 900eV is hypothesized as sufficient and will be further checked. For 1T phase, after the configuration goes beyond 13×13×1, the energy difference is below 0.01eV, so we would use 13×13×1 for later calculation. For 1T’ phase, after the configuration goes beyond 15×15×1, the energy difference is below 0.01eV, so we would use 15×15×1 for later calculation.
| Ecut | Configuration | number of irreducible k points | energy(eV) | energy difference(eV) |
|---|---|---|---|---|
| 900 | 10×10×1 | 14 | -647.6695202 | -- |
| 900 | 12×12×1 | 19 | -647.6771917 | -0.0076715 |
| 900 | 13×13×1 | 21 | -647.6894468 | -0.0122551 |
| 900 | 15×15×1 | 27 | -647.6928398 | -0.003393 |
| 900 | 20×20×1 | 44 | -647.69014 | 0.0026998 |
| Ecut | configuration | number of irreducible k points | energy(eV) | energy difference(eV) |
|---|---|---|---|---|
| 900 | 10×10×1 | 25 | -1309.782212 | -- |
| 900 | 12×12×1 | 36 | -1309.753284 | 0.028928 |
| 900 | 15×15×1 | 64 | -1309.769129 | -0.015845 |
| 900 | 20×20×1 | 100 | -1309.766136 | 0.002993 |
plane-wave basis set cutoff energy(Ecut) Convergence
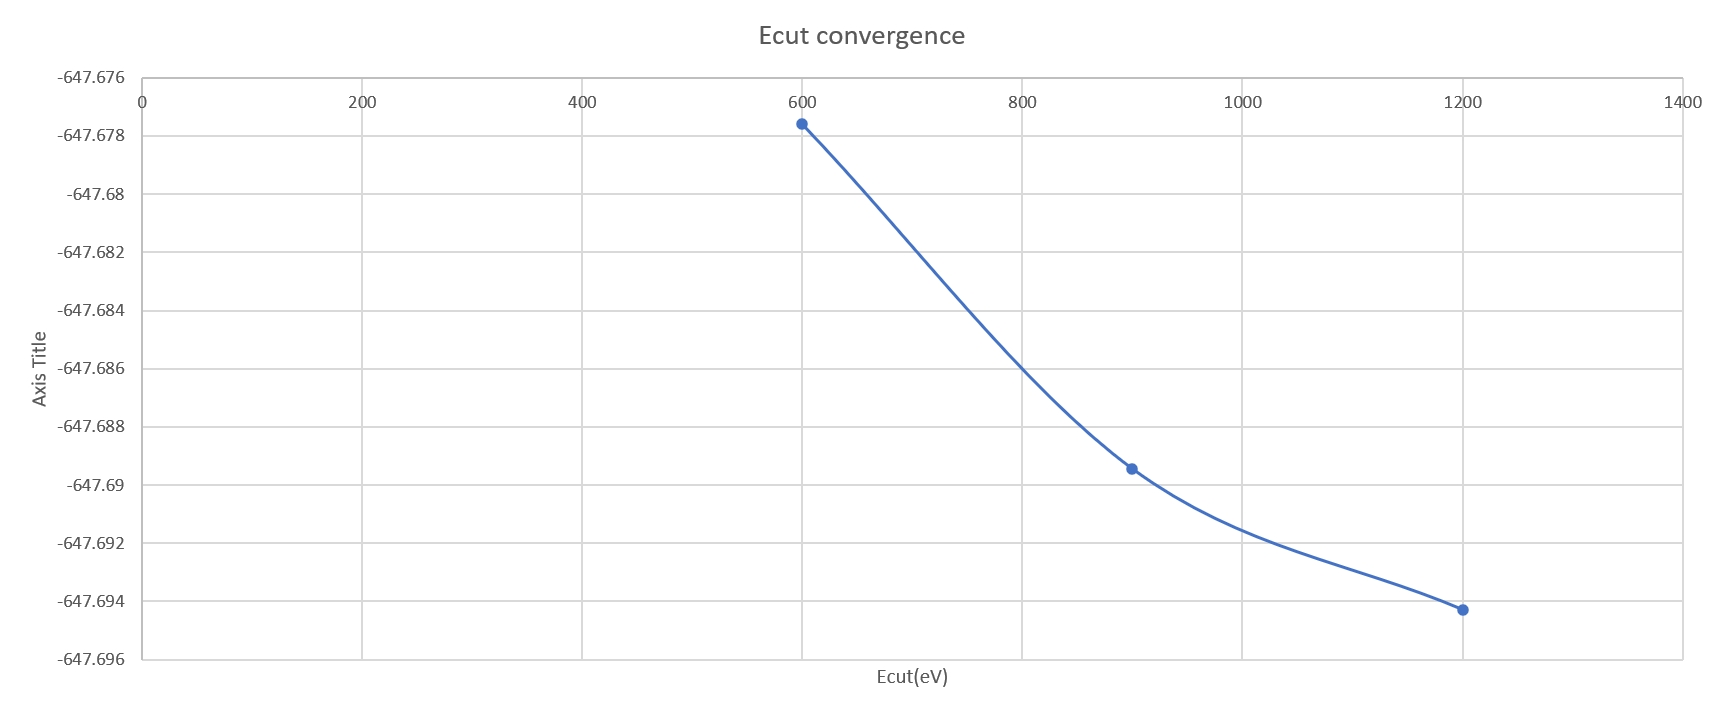
The convergence of Ecut is checked using k point configuration determined from the previous section(13×13×1 for 1T WTe2 and 15×15×1 for 1T’ WTe2 ). For 1T and 1T’ phase, the energy difference drops below 0.01 eV when the Ecut exceeds 900eV. So we will use 900eV as Ecut for the band calculation.
| Ecut | configuration | number of irreducible k points | energy(eV) | energy difference(eV) |
|---|---|---|---|---|
| 600 | 15×15×1 | 21 | -647.6775926 | -- |
| 900 | 15×15×1 | 21 | -647.6894468 | -0.0118542 |
| 1200 | 15×15×1 | 21 | -647.6942889 | -0.0048421 |
| Ecut | configuration | number of irreducible k points | energy(eV) | energy diffference(eV) |
|---|---|---|---|---|
| 600 | 15×15×1 | 64 | -1309.741619 | -- |
| 900 | 15×15×1 | 64 | -1309.769129 | -0.02751 |
| 1200 | 15×15×1 | 64 | -1309.769712 | -0.000583 |
Band Structure
Band structure is calculated with 0.015A-1 separation in the k space. For 1T WTe2, we choose the path G-M-K-G while for 1T’ WTe2, we choose Y-G-Y. Only the bands close to the Fermi surface is shown. For the 1T’ phase, without SOC, the bands will closely touch each other. However, if we take SOC into account, there will be a gap opening at the touching point.

Fig 4.c Band structure for 1T’ phase with SOC. The orange arrow labels the gap opening due to the SOC
Fig 5 is the band structure of 1T’ WTe2 from the published papers[3]. The band structure near the Fermi surface is qualitatively similar to what we’ve calculated. The gap opening due to the SOC is also confirmed in our post.
Conclusion
In this post, we calculate the band structure for monolayer 1T and 1T’ WTe2. We saw that SOC will open a gap when bands touching each other. However, to further determine if there are topological properties such as band inversion, the further calculation to track how the band evolves from 1T to 1T’ is needed.
Reference
1 Burke, K. The ABC of DFT. (2007).
2 Clark, S. First principles methods using CASTEP. Z. Kristallogr 220, 567-570 (2005).
3 Wu, S. et al. Observation of the quantum spin Hall effect up to 100 kelvin in a monolayer crystal. Science 359, 76-79, doi:10.1126/science.aan6003 (2018).
4 Tang, S. et al. Quantum spin Hall state in monolayer 1T’-WTe2. Nature Physics 13, 683-687, doi:10.1038/nphys4174 (2017).


Sorry for the sudden comment.
When you did your calculations, what did you refer to for the lattice constants and atomic coordinates of 1T-WTe2 and 1T’-WTe2?