Author Archives: Haoran He

Kinetic Monte Carlo for H2 Langmuir Adsorption-Desorption

This project aims to apply Kinetic Monte Carlo to study dynamic H2 dissociation on a homogeneous surface and to approach traditional Langmuir adsorption model. Fichthorn et al. presented details of theoretical basis for dynamic Monte Carlo and gave an example of non-dissociative adsorption [1]. Based on their research, we utilized Kinetic Monte Carlo to further explore dissociative adsorption on surface.

Kinetic Monte Carlo Parameters Set Up
We assume each H atom adsorbed on surface does not interact with another H atom nearby and occupy one adsorption site. And there is no site difference in our model. Adsorption equilibrium will be achieved when adsorption rate is equal to desorption rate.There are basically two criterion we should choose carefully. The first one is to decide event happening probability. In H2 dissociatively adsorption, there are two events in total, namely, H2 dissociatively adsorb on surface, with rate of rads and 2H associatively desorb from the surface to form H2, with rate of rdes. Therefore, we choose adsorption probability as Pads=rads/(rads + rdes). If randomly selected number i is larger than Pads, then we select two neighboring H atoms to desorb from the surface and if i is smaller than Pads, then we select two neighboring vacancy sites on surface to adsorb 2H atoms. The second criterion is the time increment, which can be described as 1/(rads + rdes), based on first criterion. rads and rdes can be calculated as the following equations:

where theta is the surface coverage, kads is the adsorption rate constant and kdes is the desorption rate constant, PH2 is H2 pressure, which is set as 1 atm in our case. Since kads and kdes vary among different surfaces, we randomly choose kads=3 and kdes=2 in our case. But specific value can be obtained through calculating activation barrier and transition state theory depending on different surfaces. In the following section, we will discuss H2 dissociation on Pd(111) surface.

Results
Surface lattice and coverage are shown in Figure 1 and Figure 2.

Figure 1. The surface lattice at equilibrium state with blue dots representing H atoms


Figure 2. Kinetic Monte Carlo derived surface coverage of H and Langmuir adsorption analytical solution

H2 dissociation on Pd(111) surface
As mentioned above, transition state theory can be applied to obtain H2 dissociation rate constant. We take 5 layer 3X3 Pd (111) surface slab as an example. The Vienna ab initio simulation program (VASP) was used for all DFT calculations [2-4]. The Perdew−Burke−Ernzerhof (PBE) generalized gradient approximation [5] was applied with a plane wave basis set with energy cutoff of 450 eV. A 4 × 4 × 1 Monkhorst−Pack k-point mesh for surface slab was used [6]. Structural optimization was carried out until the force on all atoms was less than 0.05 eV/Å. The climbing image nudged elastic band method (CI-NEB) was used to find transition state [7,8]. Optimized initial state, transition state and final state are shown in Figure 3. It is notable that the key point of this part is to illustrate how to obtain rate constant based on DFT transition state search. Exploration about the most stable final structure is not involved in this work. Usually, hollow site is the most favorable for H adsorption. But for the sake of time and illustrating the key point, we simply chose atop site as the final state. Activation barrier obtained from DFT calculation is 0.015 eV and corresponding rate constant under 298 K is 1.1X10^13/s.

Figure 3. H2 dissociation on Pd (111) initial state, transition state and final state

In conclusion, we utilized Kinetic Monte Carlo to explore dynamic change of surface coverage during H2 dissociation and equilibrium coverage is in consistency with Langmuir adsorption model. We further illustrate an example about how to obtain H2 dissociation rate constant based on transition state theory.

Reference
[1] K. Fichthorn and W. Weinberg. J. Chem. Phys 95 1090 (1991)
[2] G. Kresse and J. Furthmüller. Comput. Mater. Sci. 6 (1996)
[3] G. Kresse and J. Furthmüller. Condens. Matter Mater. Phys. 54 (1996)
[4] G. Kresse and J. Hafner. Phys. Rev. B: Condens. Matter Mater. Phys. 47 (1993)
[5] J.P. Perdew; K. Burke and M. Ernzerhof. Phys. Rev. Lett. 77 (1996)
[6] H.J. Monkhorst and J. D. Pack. Phys. Rev. B. 13 (1976)
[7] G. Henkelman; B. P. Uberuaga and H. Jonsson. J. Chem. Phys. 113 (2000)
[8] G. Henkelman; and H. Jonsson. J. Chem. Phys. 113 (2000)

Zero point energy of H on Cu(111) hollow sites


This project aims to find zero point vibrational energy (ZPVE) for H atom adsorbed at Cu(111) hollow site through calculating Hessian matrix, which was built through second order finite difference approximation.

H adsorption optimization
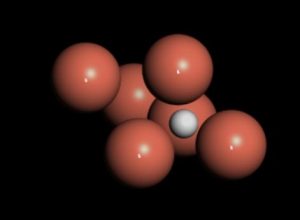
The geometry optimization was performed in Material Studio with CASTEP Calculation Package [1]. The functional of Perdew Burke, and Ernzerhoff was employed [2]. Cu bulk was first optimized with medium SCF tolerance. Energy cutoff of 480 eV and 9 X 9 X 9 K points sampling were used. The pseudopotential was solved through Koelling-Harmon treatment. After Cu optimization, 111 surface was cut from bulk and H atom was place at hollow hcp site. K points of 11 X 11 X 1 was applied for slab optimization. Figure 1 shows optimized configuration, in which four layers of Cu was chosen and 20 angstrom vacuum was built above the surface to ensure no interaction between super cells.


Figure 1. Optimized H adsorption at Cu (111) hollow hcp site


Figure 2. Optimized H adsorption at Cu (111) hollow fcc site

Energy of structure with 0.05 angstrom H displacement at hcp site

deltaxdeltaydeltazE(eV)
0
00-5057.904815339
-0.0500-5057.900058684
0.0500-5057.900254389
0-0.050-5057.899918579
00.050-5057.900491436
00-0.05
-5057.902027622
000.05-5057.897504906
0.050.050-5057.895183611
0.05
-0.05
0-5057.894736028
-0.050.050-5057.896567514
-0.05-0.050-5057.895964697
0.0500.05-5057.893632073
0.050-0.05-5057.896676147
-0.0500.05-5057.893493162
-0.050-0.05-5057.896416514
00.050.05-5057.893875845
00.05-0.05-5057.896914666
0-0.050.05-5057.893352868
0-0.05-0.05-5057.896277175

Energy of structure with 0.05 angstrom H displacement at fcc site

deltaxdeltaydeltazE(eV)
000-5057.908254387
-0.0500-5057.903846876
0.0500-5057.902812323
0-0.050-5057.905355245
00.050-5057.901336034
00-0.05-5057.903434736
000.05-5057.900649874
0.050.050-5057.896923968
0.05-0.050-5057.900397672
-0.050.050-5057.895898678
-0.05-0.050-5057.900587944
0.0500.05-5057.896058663
0.050-0.05-5057.897022898
-0.0500.05-5057.896937081
-0.050-0.05-5057.898270256
00.050.05-5057.894816130
00.05-0.05-5057.895334570
0-0.050.05-5057.898164719
0-0.05-0.05-5057.900003390

Then finite difference approximation was used to calculate Hessian matrix elements. The diagonal element can be obtained as equation (1) and off-diagonal element can be obtained from equation (2).
\begin{equation} H_{ii} \cong \frac{E(\delta x_{i})+E(-\delta x_{i})-2E_{0}}{\delta x_{i}^2} \end{equation}
\begin{equation} H_{ij} \cong \frac{E(\delta x_{i}, \delta x_{j})+E(-\delta x_{i},-\delta x_{j})-E(\delta x_{i}, -\delta x_{j})-E(-\delta x_{i}, \delta x_{j})}{4\delta x_{i}\delta x_{j}} \end{equation}

After calculating eigenvalues of Hessian matrix, we can calculate vibrational frequency and corresponding zero point energies, which is shown in following table.

siteZero point energy (eV)
hcp0.1893
fcc0.2001

Conclusions
In this project, we applied harmonic approximation and use finite difference approximation to calculate vibrational frequency of H atom adsorbed at the Cu(111) hollow sites and further zero point energy. According to our calculation, the zero point energy of H on hcp site is 0.1893 eV and H on fcc site is 0.2001 eV. The difference of the zero point energies between H on fcc site and hcp site are less 0.011 eV.

Reference
[1] “First principle methods using CASTEP” Zeitschrift fuer Kristallographie 220(5-6) pp. 567-570 (2005)
[2] Perdew, J. P; Burke, K; Ernzerhof, M. Phys. Rev. Lett. 1996, 77, 3865-3868

Exploring influence of molecular initial guess geometry on optimization

In this project, H2O and HCN molecules were optimized starting with different initial structures, in order to explore the effect of initial structure guess on optimization process and final optimized geometry.

Methods
The geometry optimization was performed in Material Studio with CASTEP Calculation Package [1]. The functional of Perdew Burke, and Ernzerhoff was employed [2]. Since H2O and HCN are two dimensional molecules, two degrees of freedom, including bond length and angle need to be considered for optimization.

Determine Lattice Parameter
To mimic a gas phase molecule, a supercell representing empty space needs to be built. Fig. 1a shows the energy change with lattice parameter and Fig. 1b shows the computational time change with lattice parameter. Considering computational cost and accuracy, lattice parameter of 10 Å was chosen for further study, as energy change between 10 Å and 9 Å is only 0.001 eV, and energy change between 10 Å and 12 Å is also 0.001 eV.


Fig 1 a, Energy change with lattice parameter; 1 b, computational time with lattice parameter

Determine Energy Cutoff
Similar to lattice parameter determination, energy cut-off determination was based on computational cost and accuracy, which were shown in Fig 2. Energy cut-off of 750 eV was chosen for further studies as energy tolerance is less than 0.005 eV.


Fig 2 a, Energy change with energy cut-off; 1 b, computational time with energy cut-off

H2O structure
Influence of initial bond length on optimization
In this section, we will explore how initial O-H bond length affect optimization by fixing H-O-H bond angle 110.37 degree and changing H-O bond length.

Fig 3. Initial structure of H2O molecule
We can see from Table 1, the optimized O-H bond length is 0.97 Å. As initial guess molecule geometry getting closer to the optimized molecular geometry, the computational time and number of iteration will decrease. There is no big difference on final energies and optimized H-O-H bond angle for different initial structures.

Influence of initial bond angle on optimization
In this section, we will explore how initial H-O-H bond angle affect optimization by fixing H-O bond 0.97 Å, as shown in Fig 4.

Fig 4. Fixed H-O bond length and changing H-O-H bond angle
From Table 2, we can see the optimized O-H bond length is 0.97 Å and H-O-H bond angle is 104.23. As initial guess molecule geometry getting closer to the optimized molecular geometry, the computational time and number of iteration will decrease. There is no big difference on final energies and optimized O-H bond length for different initial structures.

HCN structure
Influence of initial H-C bond length on optimization
In this section, we will explore how initial C-H bond length affect optimization by fixing C-N bond length of 1.51 Å and H-C-N bond angle of 180, as shown in Fig 5.

Fig 5. Fixed C-N bond length and H-C-N bond angle
We can see from Table 3, the optimized C-H bond length is 1.075 Å and H-C-N bond angle is about 179.9 degree. As initial guess molecule geometry getting closer to the optimized molecular geometry, the computational time and number of iteration will decrease. There is no big difference on final energies and optimized C-N bond length for different initial structures.

Influence of initial H-C-N bond angle on optimization
In this section, we will explore how initial H-C-N bond angle affect optimization by fixing C-N bond length of 1.159 Å.
It is worth to note that in Table 4, the first 4 rows we were attaching H to N in order to make the corresponding angle. It turned out that such initial structure will generate C-N-H molecule after optimization, as shown in Fig 6. From the first 4 rows, we can conclude as initial geometry getting closer to optimized structure, the optimization time and number of iteration will decrease. But for the last row data, we attached H to C atom and H-C-N angle is very close to optimized structure, we found energy of H-C-N molecule is lower than C-N-H molecule.


Fig 6. optimized C-N-H molecule from Table 5 first 4 rows data.

Conclusion
A good estimate of atomic geometry will greatly increase DFT calculation speed.

Reference
[1] “First principle methods using CASTEP” Zeitschrift fuer Kristallographie 220(5-6) pp. 567-570 (2005)
[2] Perdew, J. P; Burke, K; Ernzerhof, M. Phys. Rev. Lett. 1996, 77, 3865-3868

Determination of Pt crystal structure and corresponding lattice constant

In this project, the energetically favorable crystal structure of Pt and corresponding lattice constant were determined using Density Functional Theory. The total energies were computed in Material Studio with CASTEP Calculation Package [1]. The functional of Perdew Burke, and Ernzerhoff was employed [2]. A plane wave basis set was used with a cut-off energy of 321.1 eV and OTFG ultrasoft pseudopotentials was solved using Koelling-Harmon treatment. The pseudo atomic calculation was performed for Pt 4f14 5s2 5p6 5d9 6s1.

Determine Energy Cut-off
The energy cut-off was determined by considering both calculation accuracy and computational cost. Pt fcc with lattice constant of 3.21 angstrom was randomly selected to perform a series of calculation, in order to determine energy cut-off. As shown in Fig.1, the fluctuation of cohesive energy becomes smaller as energy cut-off increases, while the computational cost has an increasing trend. In order to guarantee the accuracy and stability of our data and also keep computational cost acceptable, we choose energy cut-off 321.1 eV.


Fig.1 a.cohesive energy for 12 energy cut-off values b. computational time for 12 energy cut-off values

Determine K Points
Similar to energy cut-off determination, determining the number of K points was also based on calculation accuracy and calculational expense. From Fig.2, it is clear that computational cost increase with number of K points and cohesive energy becomes more stable with the energy difference of 0.05 eV between 20 and 28 kpoints


Fig.2 a.cohesive energy for 6 K points values b.Computational time for 6 K points values

Determine Pt Crystal Structure and Lattice Constant
Simple cubic structure
For simple cubic structure, 10 × 10 × 10 K points were sampled with 0.1 eV Gaussian smearing width. The energetically most favorable lattice constant is 2.6 Å with cohesive energy of -9.175 eV.

Fig.3 Cohesive energies of Pt in simple cubic structure as a function of lattice parameters

Face center cubic structure
For face center cubic structure, 12 × 12 × 12 K points were sampled with 0.1 eV Gaussian smearing width. The energetically most favorable lattice constant is 3.924 Å with cohesive energy of -9.667 eV.

Fig.4 Cohesive energies of Pt in fcc structure as a function of lattice parameters

Hexagonal Close Packed (hcp) Structure
When performing calculations of Pt hcp, two parameters had to be considered. We randomly selected three lattice constants of a and 12 c values for corresponding a. 12 × 12 × 8 K points were sampled with 0.1 eV Gaussian smearing width. The energetically most favorable lattice constant is 2.7 Å and height of 5.4 Å with cohesive energy of -9.512 eV.

Fig.5 Cohesive energies of Pt in hcp structure as a function of lattice parameters

Conclusion
From calculations performed above, we can conclude fcc structure with lattice constant of 3.924 Å is energetically most favorable for Pt, which is in a good agreement with experiment 3.912 Å [3].

Reference
[1] “First principle methods using CASTEP” Zeitschrift fuer Kristallographie 220(5-6) pp. 567-570 (2005)
[2] Perdew, J. P; Burke, K; Ernzerhof, M. Phys. Rev. Lett. 1996, 77, 3865-3868
[3]”Precision Measurement of the Lattice Constants of Twelve Common Metals” Davey, Wheeler, Physical Review. 25 753-761 (1925)