Author Archives: Andrew Wong

Transition State Search of NO2 dissociation to NO and O on Fe (110) surface

Author: Andrew Wong

1. Abstract

The purpose of this post is to study the dissociation of NO2 to NO and O on Fe (110) surface by performing a transition state search using the nudged elastic band method. A reaction energy diagram was constructed to evaluate the activation barrier for this particular reaction. The properties and geometry of the transition state were then studied by comparing it to the proposed initial and final states.

2. Introduction

NO2 reduction is an important area of research as its reaction path leads to the production of several industrially vital products, such as NH3 and N2O [1]. The reduction of NO2 into NH3 is important for environmental applications, such as water remediation projects. Additionally, research on Fe as a catalyst in NO2 reduction is of particular interest, especially in the applications of electrocatalysis in environmental systems. [2]. Using the nudged elastic band method, the purpose of this post is to utilize density functional theory calculations (DFT) to determine the transition state to reduce NO2, nitrogen dioxide, to NO, nitric oxide, and O, atomic oxygen, on an Fe (110) surface. Fe as a catalyst was selected for its catalytical desirable properties and is the most optimal pure candidate for the Haber-Bosch process of reducing N2 to NH3 [3].

3. Methodology

3.1 Calculation Parameters

A plane wave basis set with pseudo potentials in the Vienna Ab initio Simulation Package (VASP) was used to perform all DFT calculations. The Perdew, Burke, and Ernzerhof functional (PBE) was selected to model the electron-electron exchange and correlation energies. The projector augmented-wave (PAW) method was implemented to represent the ion-core electron interactions [5]. The Monkhorst-Pack method was utilized to model the K-point grid. An Fe core radius of 2.4 Bohrs (1.27 Å) with a panel of 8 valence electrons ( 3d6 and 4s2) was chosen with an electronic convergence tolerance of 2E-06 eV in all calculations. For all calculations, a cutoff energy of 450 eV was selected as this was seen to be optimal energy cutoff value during the geometry optimization calculations of the molecules and the Fe surface.

3.2 Model Parameter

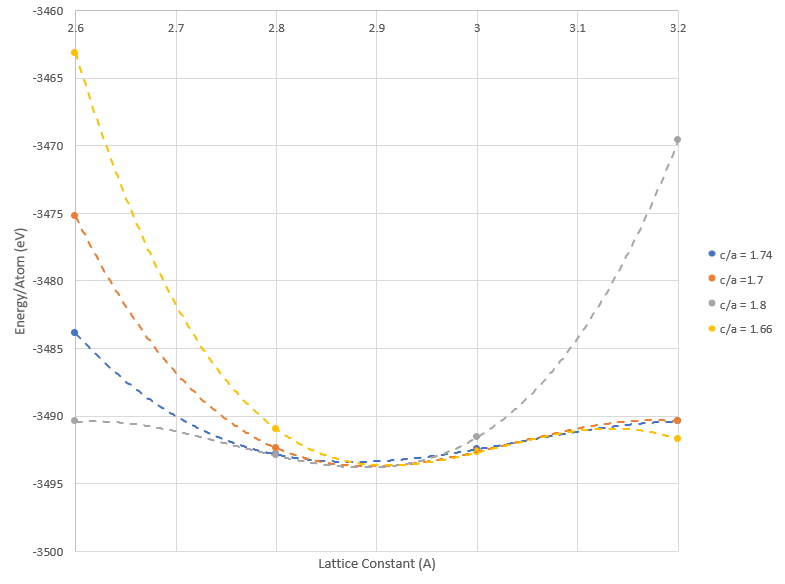
From previous post, a 4 layer 3 x 3 Fe (110) surface was used and optimized as it is the most stable termination facet of Fe [2]. The slab was modeled with a vacuum region of approximately 10 Å with a k-point mesh of 5 x 5 x 1 and cutoff energy of 450 eV. To imitate the bulk Fe, the bottom two layers of the slab were fixed. Lastly, dipole corrections and selective dynamics were used.

3.3 Transition State Search Algorithm

Transition State searches in this post employ the Climbing Image Nudged Elastic Band Method (NEB) to determine the transition state [4]. Geometry optimizations of the initial and final states were performed at a k-point mesh of 5 x 5 x 1 and cutoff energy of 450 eV. The reactant and product states were defined as NO2 to NO and O. Figure 1 below displays the optimized initial, transition, and final states.

Figure 1. Top and side views of initial, transition, and final states of NO2 reducing to NO and O
Blue: Nitrogen Red: Oxygen, Purple: Iron

Based on the optimized structures of the reactant and product states, eight linearly interpolated images were created to determine the transition state. Once the tangential forces of the highest energy image is less than the absolute value of 0.05 eV/Å, the transition state search is complete. An animation of this particular transition state search is shown below.

Movie 1: Transition state search of reducing NO2 to NO and O using eight linearly interpolated images from NEB Method. Red: O, Blue: N, Purple: Fe

4. Results and Discussion

Once the transition state search was complete, a reaction energy diagram was constructed to determine the transition state and the activation barrier of this reaction. Using the eight linearly interpolated images, energies were plotted below in figure 2 relative to the reactant state.

Figure 2: Reaction Energy Diagram for transition state search of NO2 to NO + O

From the transition state search, This transition state was confirmed as it had a single imaginary zero-point vibrational frequency value. From figure 2, the activation barrier was determined to be a value of 0.72 eV. Additionally, this reaction is energetically downhill favorable as the difference between the product and reactant state is approximately 2 eV.

During the trial transition state search, It is important to note that when using four linearly interpolated images, the NEB method missed a saddle point between the initial image and the first interpolated image. This was confirmed as the first image did not have an imaginary vibration frequency value during zero-point vibrational energy calculations. As a result, another transition state search was performed by creating an additional four images by linearly interpolating the original initial state and the first interpolated image. A reaction diagram including the 8 linearly interpolated images is shown below in figure 2.

As seen in figure 2, the transition state was concluded to be more similar the initial state than final state. Figure 3 was constructed to compare the bond lengths between the reactant and transition state.

Figure 3: Comparing bond lengths between Initial and Transition State. Red: O, Blue: N, Purple: Fe

As seen in figure 3, the NO bond length between oxygen atom 1 in the reactant and transition state is approximately the same. However, the NO bond of oxygen atom 1 rotated out of the plane approximately 90 degrees in the transition state, primarily contributing to the increase of 0.72 eV in energy. Additionally, the N atom began to adsorb between the adjacent Fe atom. Both of these observations most likely occurred to allow the oxygen atom 1 to rotate above the nitrogen atom like in the final proposed state. For the NO bond interaction between oxygen atom 2, elongation of the NO bond and stronger adsorption towards the Fe surface occurred. Specifically, the bond length increased by 0.2 Å to allow this atom to dissociate from the NO2 and adsorb more strongly to the Fe surface atoms.

5. Conclusion

Using the NEB method, a transition state with an activation barrier of 0.72 eV was found for the reduction of NO2 to NO and O. Although a particular transition state for the NO2 reduction was found, it is important to note that the NEB method are local minimization calculations. As local minimization calculations, it cannot confirm whether other transition states that are between the initial and final states also exist [7]. Particular caution should be considered when using the NEB method around the saddle point as using not a sufficient number of images can neglect a transition state during the transition state search. Based on a particular DFT adsorption study, the reaction barrier differed by approximately 0.1 eV [8]. Improvements on this transition search can be made by allowing the NO to adsorb onto the hollow site in the product state, the most stable site, rather than the short bridge site. Overall, the dissociation of NO2 onto the Fe (110) is an energetically favorable reaction with an activation barrier of 0.72 eV.


6. Citations

[1] Liu, Jin-Xun, et al. “Activity and Selectivity Trends in Electrocatalytic Nitrate Reduction on Transition Metals.” ACS Catalysis, vol. 9, no. 8, 2019, pp. 7052–7064., doi:10.1021/acscatal.9b02179.

[2] Maheshwari, Sharad, et al. “Elementary Kinetics of Nitrogen Electroreduction on Fe Surfaces.” AIP Publishing, AIP Publishing LLC, 28 Jan. 2019, aip.scitation.org/doi/full/10.1063/1.5048036.

[3] Alois Fürstner, ACS Central Science 2016 2 (11), 778-789

DOI: 10.1021/acscentsci.6b00272

[4] G. Henkelman, H. Jónsson, Improved tangent estimate in the nudged elastic band method for finding minimum energy paths and saddle points, The Journal of Chemical Physics, 113 (2000) 9978-9985.

[5] Init.at. “Vienna Ab Initio Simulation Package.” VASP, www.vasp.at/.

[6] Rostgaard, and Carsten. “The Projector Augmented-Wave Method.” ArXiv.org, 12 Oct. 2009, arxiv.org/abs/0910.1921.

[7] Scholl, David S. and Steckel, Janice A. “Density Functional Theory: A Practical Introduction” Wiley (2009).

[8] Xu, Lang, et al. “Atomic and Molecular Adsorption on Fe(110).” Surface Science, North-Holland, 12 Sept. 2017, www.sciencedirect.com/science/article/pii/S0039602817305988?via=ihub.

Preferred adsorption sites of atomic oxygen on Fe(110) surface

Author: Andrew Wong

1. Introduction

The goal of this post is to determine the preferred adsorption site of atomic oxygen (O) on the iron (Fe) (110) surface using DFT techniques. Due to their catalytic and magnetoelectric properties, iron and iron oxides are vital in various applications [1]. On the BCC Fe (110) surface, the most stable termination of Fe [2], there are four potential adsorption sites that O can adsorb onto; on top (OT), long bridge (LB), short bridge (SB), and the pseudo-three fold bridge (TB). To better understand adsorption of atomic oxygen on the Fe (110) surface, plane wave basis Density Functional Theory (DFT) was implemented with the Vienna Ab initio Simulation Package (VASP) [3] to calculate the corresponding adsorption energy of each of the four sites. By comparing these energies, the most preferred adsorption site of atomic oxygen on the Fe (110) surface can be determined by which site had the most negative adsorption energy.

2. Methodology

2.1 Calculation Parameters

The DFT calculations performed in this post utilized the plane wave basis set with pseudo potentials method in Vienna Ab initio Simulation Package (VASP). The Perdew, Burke, and Ernzerhof functional (PBE) was implemented to model the electron-electron exchange and correlation energies. To represent the ion-core electron interactions, the projector augmented-wave (PAW) method was implemented [4]. The Monkhorst-Pack was utilized to model the K-point grid. An Fe core radius of 2.4 Bohrs (1.27 Å) with a panel of 8 valence electrons ( 3d6 and 4s2) were implemented with an electornic convergence tolerance of 2E-06 eV in all calculations. For all calculation, a cutoff energy of 400 eV was implemented as this was seen to be optimal energy cutoff value during the geometry optimization calculations.

2.2 Optimization of Triplet Oxygen in Gas Phase

Before adsorption energies of atomic oxygen on Fe (111) surface can be calculated, the energy of diatomic oxygen must be calculated first. A geometry optimization of diatomic oxygen in the gas phase was performed in a 15 x 15 x 15 Å vacuum cube at an energy cutoff value of 400 eV and a 1 x 1 x 1 K Point set.

2.3 Construction and Optimization of Fe(110) Vacuum Slab

Based on literature that also utilized VASP for electronic structure calculations ,the 3 x 3 Fe (110) slab model was determined to be the most stable termination of Iron [2]. Specifically, a vacuum region of approximately 10 Å with a k-point mesh of 5 x 5 x 1 was utilized to constructed the slab model. A cutoff energy of 400 eV was also implemented as well. Dipole corrections and selective dynamics were implemented as the bottom two layers were fixed to imitate the bulk iron and the two top layers were relaxed. Figure 1 below presents the Fe (110) surface slab model constructed.

Figure 1a: Side View of 3 x 3 Fe (110) Slab Model

Figure 1b: Top View of 3 x 3 Fe (110) Slab Model

2.4 Adsorption of Atomic Oxygen on Fe(110) Surface

For the BCC Fe (110) surface, there are four potential sites of adsorption: On top (OT), Short bridge (SB), Long bridge (LB), and Pseudo-Three Fold Bridge (TB) [5]. A top view figure of these four sites are presented in figure 2 below.

Figure 2: Top View of Potential Adsorption Sites of BCC Fe (110)

In order to determine the most preferred site of atomic O on Fe (110) surface, adsorption energies of O onto the Fe (110) surface must be calculated from geometry optimization calculations. The adsorption site corresponding with the lowest adsorption energy is the most thermodynamically favorable site for O on Fe (110).  In order to calculate the adsorption energies for each site, the following equation was used. [6]

sadf

Three terms are needed to calculate the adsorption energy. The energy of the Fe surface with O adsorb onto it will need to be determined first. To calculate the energy of a O adsorbate, half of the energy of diatomic oxygen will be utilized as it is easier to perform a geometry optimization on diatomic oxygen rather than atomic oxygen and there are more readily available experimental values for diatomic oxygen. Lastly, the energy of the bare Fe (110) surface without the adsorbate will be needed. As a result, the adsorption energies can then be compared to determine which adsorption site is the preferred site O to adsorb on.

3. Results and Discussion

Using the optimal K-point grid of 5 x 5 x 1 and cutoff energy of 400 ev, Figure 3 was constructed below to represent the top view of the four adsorption sites of Fe (110) with 1/9 ML surface coverage of O after geometric optimization done in VASP.

Figure 3. Optimization of atomic O on Fe (110) top view for the following four sites a. On Top b. Long Bridge c. Short Bridge d. Pseudo-Three Fold Bridge

The table below lists the results of the adsorption energy and distance of the O atom from the Fe (110) surface for the four potential adsorption sites. By comparing the adsorption energies between each site, it can be seen that the adsorption O favors the long bridge site as this site significantly had the most negative adsorption energy compared to the other three sites. It is important to note that, although not as favorable by 0.42 eV, the short bridge site is also a  thermodynamically favorable site due to its negative adsorption energy value. This may be due to the multiple bond interactions between multiple oxygen atoms seen in the short and long bridge sites. Although the Pseudo-Three Fold bridge has multiple oxygen atom interactions, it required multiple attempts to converge exactly to this position, as it requires it to be between three oxygen atoms. As a result, the TB site is thermodynamically unfavorable for the adsorption of O onto the Fe (110) surface due to it having the highest adsorption energies. The OT Adsorption site was also favorable but it tend to converge towards the long bridge and short bridge adsorption site and did not have nearly as strong of an adsorption energy by approximately 1 – 1.5 eV.

Adsorption SitesAdsorption Energy (eV)O Distance from Fe Surface (Å)
On Top (OT)-1.25821.652
Long Bridge (LB)-2.81351.850, 2.215
Short Bridge (SB)-2.39221.795
Pseudo-Three Fold Bridge (TB)-0.95531.873, 1.928

4. Conclusion

The thermodynamically favorable adsorption sites for the 1/9 ML surface coverage of atomic O on the Fe (110) were the long bridge, short bridge sites, and the on top sites, with the long bridge adsorption site being the most preferred adsorption site. Additionally, the pseudo-three fold bridge sites was not a thermodynamically favorable site due to their positive adsorption energies. As a result, they converged to the local minimums of the long bridge and short bridge sites during the geometric optimization of the adsorbed Fe (110) surface, rarely converging towards the on top configuration. Although the DFT calculations creates a notion that the preferred adsorption site of O on the Fe (110) is the long bridge site, additional considerations, such as surface coverage variations, non-vacuum conditions, and impurities within the bulk surface model, should be noted when studying this particular adsorption chemistry in a more practical and experimental setting. An experimental study examining the adsorption of atomic oxygen on the Fe (110) surface with the use of standard surface characterization methods, such as Auger electron spectroscopy and conversion electron Mossbauer spectroscopy, has confirming agreement that the long bridge site is the preferred adsorption site [5].

5. Citations

[1] Ossowski, Tomasz, and Adam Kiejna. “Oxygen Adsorption on Fe(110) Surface Revisited.” Surface Science, North-Holland, 13 Mar. 2015, www.sciencedirect.com/science/article/pii/S0039602815000618.

[2] Maheshwari, Sharad, et al. “Elementary Kinetics of Nitrogen Electroreduction on Fe Surfaces.” AIP Publishing, AIP Publishing LLC, 28 Jan. 2019, aip.scitation.org/doi/full/10.1063/1.5048036.

3] Init.at. “Vienna Ab Initio Simulation Package.” VASP, www.vasp.at/.

[4] Rostgaard, and Carsten. “The Projector Augmented-Wave Method.” ArXiv.org, 12 Oct. 2009, arxiv.org/abs/0910.1921.

[5] Freindl, K., et al. “Oxygen on an Fe Monolayer on W(110): From Chemisorption to Oxidation.” Surface Science, North-Holland, 13 July 2013, www.sciencedirect.com/science/article/pii/S0039602813002021.

[6] Nguyen, Angela, and Angela Nguyen. Density Functional Theory and Practice Course, 2 Apr. 2019, sites.psu.edu/dftap/2019/04/02/exploring-the-effects-of-surface-coverage-on-the-binding-site-and-adsorption-energy-of-atomic-o-on-pt111/.

Determining the Optimal Crystal Structure of Pd using DFT Energy Optimization Techniques

Author: Andrew Wong

1. Introduction

Palladium is a transition metal that is vital in various technologies, such as in electronic components and fuel cells, and as an important catalytic material [1]. The goal of this post is to determine the preferred crystal structure of Palladium (Pd) based on the following three crystal structures: simple cubic (SC), face-centered cubic (FCC), and hexagonal closed packed (HCP). In order to determine the optimal crystal structure of Pd, plane wave basis Density Functional Theory (DFT) was implemented with the CAmbridge Series Total Energy Package (CASTEP) [2] in Materials Studios to calculate ground state energies of various crystal structures of Pd at different lattice constants. The lowest total energy of the three crystal structures are then compared to determine the optimal crystal structure of Pd and its respective lattice constant.  From these calculations, the optimal lattice constants of the SC and FCC structure were determined to be 2.6 Åand 3.85 Å. Since the HCP crystal structure has two lattice parameters, the optimal lattice constant of HCP were a=2.9 Å and c= 5.04 Å from an optimal c/a value of 1.8. Comparing the energy per atom of each crystal structure, the FCC structure had the lowest structure while the SC and HCP structure were 0.217 and 0.514 eV/atom higher in energy than the FCC structure. As a result, the optimal crystal structure for Pd is the FCC structure with a lattice constant of 3.85 Å.

2. Methodology

2.1 Calculation Parameters

The DFT calculations performed in this post utilized the plane wave basis set with pseudo potentials method in CASTEP. The following calculation parameters used in the DFT analysis are shown below..

Exchange-Correlation Functional TypeGeneralized Gradient Approximation (GGA)
Exchange-Correlation FunctionalPerdew-Burke-Ernzerhof (PBE)
K point GridMonkohrst-Pack [3]
PseudopotentialOTFG Ultrasoft
Relativistic TreatmentKoelling-Harmon
SCF Tolerance2E-06 eV/atom
Core Radius1.6 a.u
Valence Electron Configuration4s2 4p6 4d10

2.2 Energy Cutoff Determination

Before the optimal lattice constant and K Points for each structure were determined, an energy cutoff optimization was performed to ensure the most accurate convergence of the energy calculations. The optimal energy cutoff value is then used for all three crystal structure to maintain consistency within the calculations. A FCC Pd crystal structure with an experimental lattice constant of 3.859 Å [4] and default K Point mesh grid of 7 x 7 x 7 was used to test for energy cutoff convergence. By varying the energy cutoff values from 100 to 600 eV, a plot of total lattice energy per atom and energy cutoff is shown below in figure 1.

Figure 1

Figure 1: Energy Cutoff Convergence for FCC Pd

Based on the results from figure 1, the energy cutoff for all DFT optimization calculations was chosen to be 500 eV since the energy per atom varied less than 0.01 eV at the cutoff energy. A higher energy cutoff value, such as 600 eV or more, could have been chosen as it retains but the computational effort to run these calculations would increase. As a result, a cutoff energy of 500 eV was deemed to be optimal for the lattice calculations.

2.3 K Point Optimization

A convergence test for K Points was implemented to further ensure the energy convergence of the three crystal structures. A K Points Optimization for each crystal structure must be implemented as the number of K Points directly dependent on the lattice constant value. Lattice constants for each structure were determined using the default 7 x 7 x 7 K Point Mesh Grid  for the SC and FCC crystal structure and a 8 x 8 x 4 K Point Mesh Grid for the HCP crystal structure. The lattice constants that were determined from the default K Point mesh for the SC, FCC, and HCP structure were respectively 2.3 Å, 3.8 Å, a= 3Å and c= 5Å.

2.3.1 K Points Optimization for SC and FCC Structure

A convergence test for K Points was implemented to further ensure the energy convergence of both the SC and FCC crystal structures. This was conducted by plotting the total energy per atom of each structure with respect the number of irreducible K Points. Since the lattice constant, a, is constant on all three axis for the SC and FCC crystal structure, a Monkhorst-Pack Grid of M x M x M is utilized for K Points optimization. For both structures, an energy cutoff value of 500 eV was implemented. For the SC Structure, figure 2A was constructed below by varying the K Point Mesh size from 1x1x1 to 15x15x15 at the  SC lattice constant of 2.3 Å.

asdf

Figure 2A: K Point Determination for SC Pd Crystal Structure

As seen in figure 2A, the optimal number of K Points was determined to be 56 and a mesh grid size of 11 x 11 x 11. Higher number of K Points could have been implemented but the amount of computational effort would have increased significantly. As a result, the optimal number of K points for the simple cubic Pd structure was deemed to be 56. The energy at this number of K Points is -3492.550 eV.

Similarly, the optimal number of K Points needed for the Pd FCC crystal structure was shown below in figure 2B by varying the K Point mesh size from 1x1x1 to 10x10x10 at the optimal FCC lattice constant of 3.8 Å.

fccksa

Figure 2B: K Point Determination for FCC Pd Crystal Structure

As seen in figure 2B, the optimal number of K Points was deemed to be 365 with a K Point mesh size of 9 x 9 x 9. The energy at this number of K Points is -3493.064 eV.

2.3.2 K Points Optimization for HCP Structure

Although the HCP K Point mesh grid is in the form of M x M x N, the same K Point convergence method used for the SC and FCC structure can be used for the HCP structure. By using a cutoff energy of 500 eV and lattice constant values of a = 3 Å and c = 5 Å, figure 2C was constructed below by plotting the total energy per atom with respect to the number of irreducible K points, varying the K Points mesh grid from 1x1x1 to 10x10x5.

asdg

Figure 2C: K Point Determination for HCP Pd Crystal Structure

From figure 2C, it was determined that the optimal number of K Points for the HCP Pd Crystal structure is 162 with a Mesh Grid of 9 x 9 x 4. The total energy per atom at this specific K Point value was -3492.847 eV.

3. Results and Discussion

3.1 Lattice Optimization of Simple Cubic and Face-Centered Cubic Pd

The optimal lattice constants for both the SC and FCC crystal structures were determined by calculating the total energy of the structure at various lattice constant values. Once this is completed, the optimal lattice constant corresponds to the structure with the lowest total energy. The SC lattice constants were varied from 2.2 to 3.4 Å and the FCC lattice constants were varied from 3 to 4.4 Å. Both the SC and FCC energies were then plotted against its respective lattice constant with a K Point mesh size of 11 x 11 x 11 and 9 x 9 x 9 respectively and an energy cutoff value of 500 eV. The lattice constant determination for the Pd SC structure is shown below in figure 3A.

SC

Figure 3A.: Lattice Constant Determination for Simple Cubic Pd Crystal Structure

A polynomial fit was employed to determine the minimal energy of the Pd SC structure. As a result, the optimal lattice constant for the Pd SC structure was determined to be 2.6 Å at a total energy per atom value of -3492.711 eV. Following a similar process, the lattice constant was determined for the Pd FCC structure in figure 3B below.

FCC lattice

Figure 3B: Lattice Constant Determination for FCC Pd Crystal Structure

By varying the lattice constant from 3 to 4.4 Å and employing a third order polynomial fit, the minimal structural energy was calculated at a value of -3493.131 eV, which resulted in an optimal FCC lattice constant of 3.85 Å.

3.2 Lattice Optimization of Hexagonal Closed-packed Pd

Unlike the SC and FCC structure, two lattice constants, a and c, must be determined for the HCP crystal structure. However, the DFT energy optimization used for the SC and FCC structure can still be implemented by fixing a lattice parameter ratio, c/a, and calculating the energy of the HCP structure at various lattice constant of a. Since there are two lattice constants values in the HCP structure, the K Point mesh grid is in the form of M x M x N. As a result, a K Point mesh grid size of 9 x 9 x 4 and a cutoff energy of 500 eV was implemented for the HCP DFT lattice optimization. By varying the c/a from 1.66 to 1.8 Å, Figure 3C  was constructed below by plotting the total energy per atom with respect to the optimal lattice constants, varying the “a” lattice constant from 2.6 to 3.2 Å.

HCP

Figure 3C: Optimal Lattice Constant Determination for HCP Pd Crystal Structure

Before the optimal lattice constant can be determined, polynomial fits for each c/a ratio was implemented to determine which lattice parameter ratio had the lowest energy minimum. As a result, the lowest energy minimum occurred at a c/a ratio of 1.8 at an energy of -3492.935 eV. Furthermore, the optimal HCP lattice constants for Pd was determined to be a = 2.9 Å and c = 5.04 Å.

4. Conclusion

The table below shows a summary of the optimal lattice constant, energy cutoff, and K Points calculated for each of the three crystal structures at its minimized total energy.

Crystal Structure TypeLattice Constant (Å)Energy/Atom (eV)Energy Cutoff (eVNumber of Irreduciable K Points K Point Mesh Grid Size
Simple Cubic 2.6-3492.550
500
56
11 x 11 x 11
Face-Centered Cubic3.85-3493.064500
365 9 x 9 x 9
Hexagonal Closed-Packeda = 2.9
c = 5.04
-3492.847500
1629 x 9 x 4

From the data above, it is concluded that the preferred structure for Pd is FCC with a lattice constant of 3.85 Å since this is the structure with the lowest total energy per atom. To confirm the validity of our result, the lattice constant and structure of Pd was then compared to an experimental paper as reference which is shown below.

SourcePreferred Structure of PdOptimal Lattice Constant (A)
DFTFCC3.85
Experimental [4]FCC3.859

As seen from the table above, the DFT calculations are in agreement with the experimental source in terms of the lattice constant and the preferred crystal structure. Differences between the lattice constants are expected as the DFT calculations assume the model contains perfect shapes of each Pd crystals and is run in vacuum. In conclusions, the following DFT energy optimization technique implemented in this post confirms the preferred crystal structure of Pd to be Face-centered cubic with a lattice constant of 3.85 Å.

5. Citations

[1] “Palladium.” Wikipedia, Wikimedia Foundation, 3 Feb. 2020, en.wikipedia.org/wiki/Palladium.

[2] Clark Stewart J et al., “First principles methods using CASTEP ,” Zeitschrift für Kristallographie – Crystalline Materials , vol. 220. p. 567, 2005.

[3] H. J. Monkhorst and J. D. Pack, “Special points for Brillouin-zone integrations,” Phys. Rev. B, vol. 13, no. 12, pp. 5188–5192, Jun. 1976.]

[4] Davey, Wheeler P. “Precision Measurements of the Lattice Constants of Twelve Common Metals.” Physical Review Journals Archive, American Physical Society, 1 June 1925,