Author Archives: Lingjie Zhou

Band structure of different phases of tungsten ditelluride(WTe2)

Lingjie Zhou


Abstract

In this post, the band structure is calculated for two phases of WTe2. The effect of spin-orbital coupling(SOC) on the band structure is checked and when the SOC is turned on, there is a gap opening at the band touching point.

Introduction

Tungsten ditelluride(WTe2) has two different phases. Shown in figure 1, the 1T phase has the hexagonal structure while the 1T’ phase comes from the lattice distortion from the 1T phase. Although the structures are differed only by distortion, the 1T WTe2 is a normal semimetal but the 1T’ WTe2 is predicted to have nontrivial topological properties such as quantum spin Hall effect. This material has sparked intense research as it is a two-dimensional material and can be easily exfoliated[4]. In this post, we used plane-wave basis sets with norm-conserving pseudopotentials to perform DFT methods to calculate the band structure and density of states(DOS) for the 1T and 1T’ WTe2.

figure 1a. top view of 1T WTe2

figure 1b. side view of 1T WTe2

figure 1c. top view of 1T’ WTe2

figure 1d. side view of 1T’ WTe2

Method


The CASTEP[1] package is used to carry out the DFT calculations. The exchange and correlation functional we used is the Perdew, Burke and Ernzerhof(PBE) functional described within the generalized gradient approximation(GGA) [2]. The ‘on the fly’ generated norm conserving pseudopotential for Te was generated with 6 electrons in the valence panel with (5s2 5p4)  and for W was generated with 14 electrons in the valence panel with (5s2 5p6 5d4 6s2) as the electronic configuration. The self-consistent-field tolerance of the calculated energy is 2^-6 eV and the maximum self-consistent-field tolerance cycle is 100. The monolayer structure is created with 15 A vacuum slab.


k point Convergence 


The convergence of k point is checked on the geometrically optimized 1T and 1T’  WTe2 monolayer structure with 15A vacuum slab. The Ecut 900eV is hypothesized as sufficient and will be further checked. For 1T phase, after the configuration goes beyond 13×13×1, the energy difference is below 0.01eV, so we would use 13×13×1 for later calculation. For 1T’ phase, after the configuration goes beyond 15×15×1, the energy difference is below 0.01eV, so we would use 15×15×1 for later calculation.

EcutConfigurationnumber of
irreducible k points
energy(eV)energy difference(eV)
90010×10×114-647.6695202
--
90012×12×119
-647.6771917
-0.0076715
90013×13×121-647.6894468
-0.0122551
90015×15×127-647.6928398
-0.003393
90020×20×144-647.69014
0.0026998
Table 1.a Convergence check of k points for 1T WTe2


Ecutconfigurationnumber of
irreducible k points
energy(eV)energy difference(eV)
90010×10×125
-1309.782212
--
90012×12×1
36-1309.753284
0.028928
90015×15×164-1309.769129
-0.015845
90020×20×1100-1309.766136
0.002993
Table 1.b Convergence check of k points for 1T' WTe2


figure 2a. k point convergence of 1T WTe2

figure 2b. k point convergence of 1T’ WTe2

plane-wave basis set cutoff energy(Ecut) Convergence 


The convergence of Ecut is checked using k point configuration determined from the previous section(13×13×1 for 1T WTe2 and 15×15×1 for 1T’ WTe2 ). For 1T and 1T’ phase, the energy difference drops below 0.01 eV when the Ecut exceeds 900eV. So we will use 900eV as Ecut for the band calculation.

Ecutconfigurationnumber of
irreducible k points
energy(eV)energy difference(eV)
60015×15×121-647.6775926
--
90015×15×121-647.6894468
-0.0118542
120015×15×121-647.6942889
-0.0048421
Table 2.a Convergence of Ecut for 1T WTe2


Ecutconfigurationnumber of
irreducible k points
energy(eV)energy diffference(eV)
60015×15×164-1309.741619
--
90015×15×164-1309.769129
-0.02751
120015×15×164-1309.769712
-0.000583
Table 2.b convergence of Ecut for 1T' WTe2


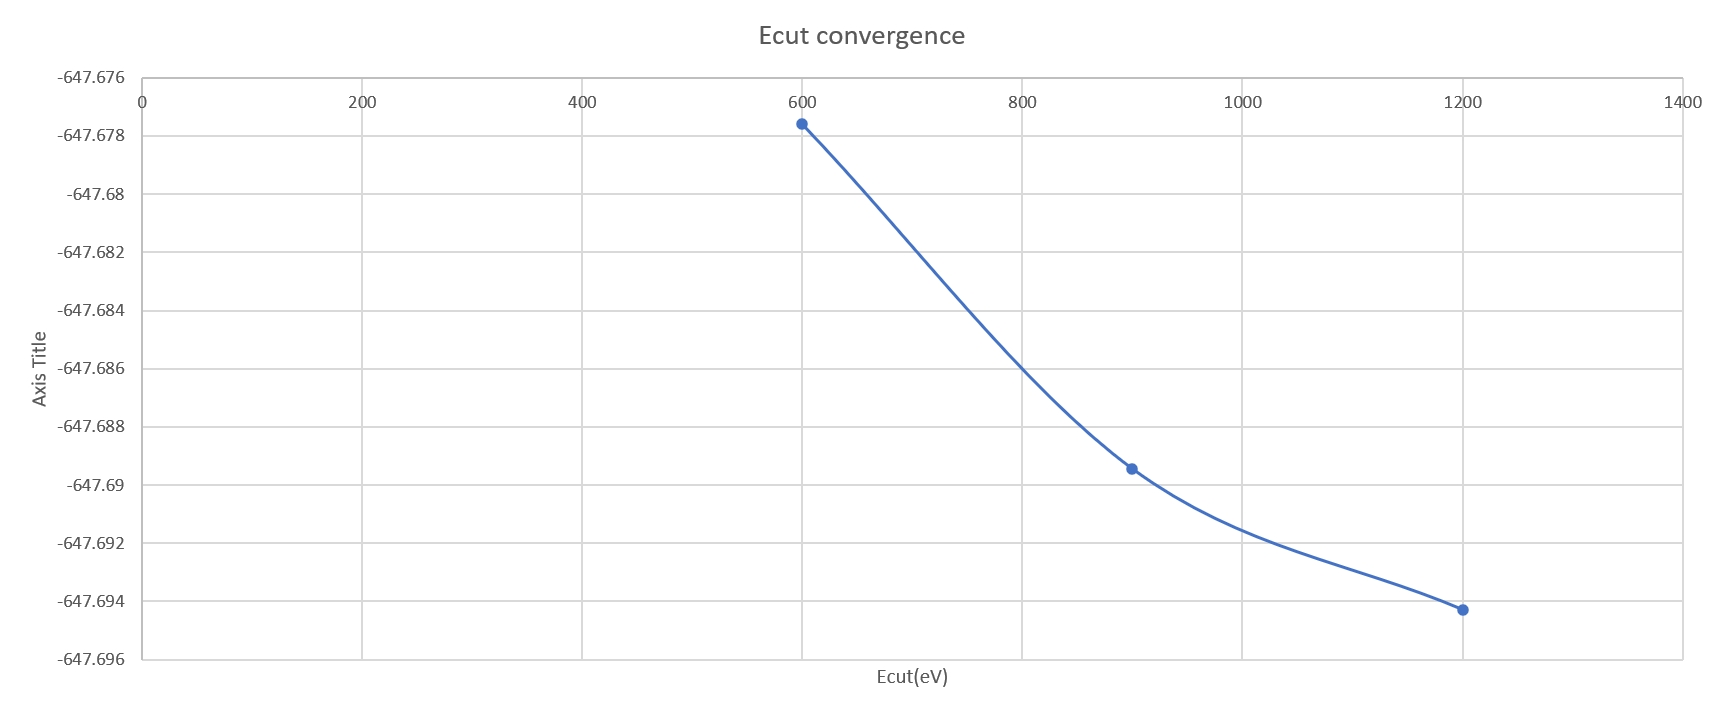
figure 3a. Ecut convergence of 1T WTe2

figure 3b Ecut convergence of 1T’ WTe2

Band Structure

Band structure is calculated with 0.015A-1 separation in the k space. For 1T WTe2, we choose the path G-M-K-G while for 1T’ WTe2, we choose Y-G-Y. Only the bands close to the Fermi surface is shown. For the 1T’ phase, without SOC, the bands will closely touch each other. However, if we take SOC into account, there will be a gap opening at the touching point.

Fig 4.a Band structure for 1T WTe2

Fig 4.b Band structure for 1T’ phase without SOC


Fig 4.c Band structure for 1T’ phase with SOC. The orange arrow labels the gap opening due to the SOC

Fig 5 is the band structure of 1T’ WTe2 from the published papers[3]. The band structure near the Fermi surface is qualitatively similar to what we’ve calculated. The gap opening due to the SOC is also confirmed in our post.


figure 5. the band structure of 1T’ WTe2 without SOC(a) and with SOC(b)

Conclusion

In this post, we calculate the band structure for monolayer 1T and 1T’ WTe2. We saw that SOC will open a gap when bands touching each other. However, to further determine if there are topological properties such as band inversion, the further calculation to track how the band evolves from 1T to 1T’ is needed.


Reference

1   Burke, K. The ABC of DFT.  (2007).

2   Clark, S. First principles methods using CASTEP. Z. Kristallogr 220, 567-570 (2005).

3   Wu, S. et al. Observation of the quantum spin Hall effect up to 100 kelvin in a monolayer crystal. Science 359, 76-79, doi:10.1126/science.aan6003 (2018).

4   Tang, S. et al. Quantum spin Hall state in monolayer 1T’-WTe2. Nature Physics 13, 683-687, doi:10.1038/nphys4174 (2017).

Reconstruction pattern of Si(001) surface

Lingjie Zhou

Introduction

Silicon(Si) is a widely used substrate for molecule beam epitaxy growth due to its high quality and low cost. However, the real surface of Si doesn’t resemble the plane directly cut from bulk material. Due to the recombination of dangling bonds, usually there will be reconstruction patterns formed at the surface. Such phenomenon have been broadly investigated and confirmed through Scanning Tunneling Microscope. To explain and predict such phenomena, we used plane-wave basis sets with ultrasoft pseudopotentials to perform DFT methods to calculate the energy of the surface with and without reconstruction.

Method


The CASTEP [1] package is used to carry out the DFT calculation. The exchange and correlation function were calculated using the Perdew, Burke and Ernzerhof(PBE) functional described within the generalized gradient approximation(GGA) [3]. The ‘on the fly’ generated ultrasoft pseudopotential for Si has a core radius of 1.8 Bohr(0.95 Angstroms) and was generated with 4 electrons in the valence panel with (3s2 3p2) as the electronic configuration.


First, the optimization of bulk material is done to make sure there is no artificial stress in the model [2]. The calculation starts from the experimentally reported result with a=5.381 A. 700eV cutoff energy and 7×7×7 kpoint set is used and the optimized value is a=5.468 Å. The number of kpoint and cutoff is initially hypothesized as sufficient before checking convergence and the convergence will be further checked.

Energy cutoff convergence


The convergence of energy cutoff is first checked by carrying out the optimization of structures with a=5.381 Å and 7×7×7 k points but different cutoff energy. The optimized result (a=5.481) is well converged if we use cutoff energy higher than 600 eV. For the rest of the calculation we would use 700 eV as cutoff energy.

Fig 1 Convergence of energy cutoff

Kpoint convergence


Here is the result if the optimization all start from experimental result(a=5.381 Å) and 700eV cutoff but use the different number of kpoints(6×6×6, 8×8×8, 10×10×10, 15×15×15). The result is well-converged so that we will pick 6×6×6 for our later kpoint mesh.

Fig 2 Convergence of number of k points


Si(001) surface


First, we calculate the surface of Si(001) without reconstruction. Slabs of 3 layers, 4 layers and 5 layers of Si atoms and 10 Å vacuum is used for the calculation. During the calculation, only the atoms of the top layer are allowed to move while the rest are fixed. The optimized structure is very similar to the bulk. To calculate the reconstruction pattern, top two atoms are shifted towards each other. The optimized structure is similar to the experimentally verified reconstruction pattern.

Fig 3 Surface without reconstruction

Fig 4 Surface with reconstruction

The layer dependence of surface energy is plotted below. Due to the limitation of time and computational resources, it’s hard to reach a well-converged result. But the surface energy of reconstructed structure is always smaller than the one without reconstruction. Thus, the reconstructed pattern is preferred. With limited time and computation resources, only one reconstruction pattern is checked and other reconstruction patterns remain to be checked.

Fig 5 layer dependence of surface energy

Reference

Burke

Prediction of Au lattice constant in SC, FCC and HCP crystal structures using DFT calculation

Lingjie Zhou

Abstract

In this post, optimal lattice parameters of gold(Au) are analytically derived using Density Functional Theory(DFT) methods. Plane-wave basis set, pseudopotential DFT methods are used to calculate the energy dependence in Simple Cubic(SC), Face Centered Cubic(FCC) and Hexagonal Closest Packed(HCP) lattice system. The convergence of cutoff energy and the number of k points is also checked in this post.

Introduction

As well known, Au has a preferred lattice structure under Standard Temperature and Pressure(STD), which is FCC lattice with a=4.08Å. Single crystal gold is a good conductor and material for research purposes. Its good electronic properties make it one of the best platforms to conduct STM research. To predict which lattice structure is preferred, we need to compare the energy in different lattice structures. DFT can calculate the energy of the structures that don’t exist in nature, thus making it a powerful method to determine the optimal lattice structure theoretically. This can also enable us to predict the properties of materials that may not be normally present in experiments.

Methods:

The CASTEP[2] package is used to carry out the DFT calculation. The exchange-correlation functional is GGA-PBE. The ‘on the fly’ generated ultrasoft pseudopotential for Au has a core radius of 2.4 Bohr(1.27 Angstroms) and was generated with 32 electrons in the valence panel with (4f14 5s2 5p6 5d10 6s1) as the electronic configuration.

A kpoint set of 5×5×5 and cutoff energy 700eV is used to calculate the energy of SC and FCC lattice at different lattice parameters, while 10×10×5 kpoint mesh and 700eV cutoff energy is used for HCP lattice. The number of kpoint and cutoff is initially hypothesized as sufficient before checking convergence and the convergence will be further checked.


Figure 1 Lattice parameter optimization.a)SC using 5×5×5 kpoints and 700 eV cutoff energy 5b)FCC using 5×5×5 kpoints and 700 eV cutoff energy c)HCP using 10×10×5 kpoints and 700 eV cutoff energy

The SC lattice has its minimum energy at a=2.75Å, with E=-4.656eV. FCC lattice has its minimum energy at a=4.14 Å, with E= -5.12eV. For HCP lattice, there are two variables a and c. For fixed a/c ratio[1], the DFT can give the optimal a for the minimum energy. By comparing the minimum energy corresponding to different a/c ratio, HCP lattice has its minimum energy at a=2.91Å, a/c=1.68, with energy E=-5.018eV. Thus, the optimal lattice with these cutoff energy and kpoint choices is FCC lattice with a=4.14Å.


Cutoff energy test

The convergence of cutoff energy is tested using kpoint 5×5×5(a=2.75Å for SC and a=4.14 Å for  FCC), 10×10×5(a=2.91Å, a/c=1.68 for HCP).

Figure 2 Convergence test for the cutoff energy. a) SC with 5×5×5 kpoints, a=2.75Å b)FCC with 5×5×5 kpoints, a=414Å c) HCp with 10×10×5 kpoints, a=2.91Å, a/c=1.68

The total energy does not change more than 0.01eV beyond 400eV(SC), 500eV(FCC) and 400eV(HCP). So that the cutoff energy we used(700eV) is well satisfied.

Kpoint convergence test

After checking the convergence of cutoff energy, we need to make sure our calculation is also convergent under number of k points. Here we will check the kpoint convergence at the optimal values for the different lattices.


Figure 3 Convergence test for the kpoints. a) SC with a=2.75Å b)FCC with a=4.14Å c) HCp with  a=2.91Å, a/c=1.68. All with cutoff eneryg 700eV

The cutoff energy is 700eV for the kpoint convergence test. The energy is converged in the range of 0.01eV beyond 35 kpoints(9×9×9) for SC, 110 kpoints(10×10×10) for FCC and 120(16×16×8). The well converged total energy is -4.8149 for SC (a=2.75Å, 9×9×9, 700eV), -5.0174eV for FCC(a=414Å, 10×10×10, 700eV) and -5.011eV for HCP(a=2.91Å, a/c=1.68, 16×16×8, 700eV).


Conclusion:

Lattice StructrueMesh of k pointCutoff energyoptimal lattice parameters(Å)Binding Energy(eV)
SC9×9×9700a=2.75Å-4.8149
FCC10×10×10700a=4.14 Å-5.0174
HCP16×16×8700a=2.91Å
a/c=1.68
-5.011

The lowest energy phase of Au crystal was calculated to be FCC lattice structure with a=4.14Å. The experimental result is 4.08Å in FCC lattice structure[3], which is slightly smaller than the lattice parameters calculated.

Reference: