Author Archives: Si Chen

A density functional theory study of the preferred hydrogen position in defective Fe2O3 (hematite)

1. Project Description

In this project, we aim to find the most stable configuration of the defective hematite (\(Fe_2\)\(O_3\)) by comparing the energy of each configuration. We modeled a 3*3*1 hematite supercell first, took one of the iron atoms out of the structure, and added three hydrogens with stoichiometry. The iron occupancy of the structure was therefore 0.991. After modeling the initial configuration, Density Functional Theory (DFT), with the Vienna Ab-initio Simulation Package (VASP) code[1], was used to optimize lattice parameter and calculate the energy. The exchange-correlation was treated in the generalized gradient approximation (GGA), as parameterized by Perdew, Burke, and Ernzerhof (PBE) [2]. GGA+U was applied to correct self-interaction of the d-electrons in Fe atoms. The following valence electron configurations were employed in the potentials: 3d6 3d7 4s1 for Fe, 2s2 2p4 for O, and 1s1 for H. Psedupotentials were used in place of other electrons, with core radii of 2.200Å for Fe, 1.100Å  for O, and 0.800Å for H. The Brillouin zone integration was performed using a 1*1*1 Monkhorst-Pack k-point grid, and plane-wave kinetic energy cutoff was 800eV [3]. The SCF tolerance is 1.0e-4 eV/atom. The spin states of iron atoms in the adjacent layers were treated with opposite spin states.

2. Crystal Structure and Initial Defective Configurations

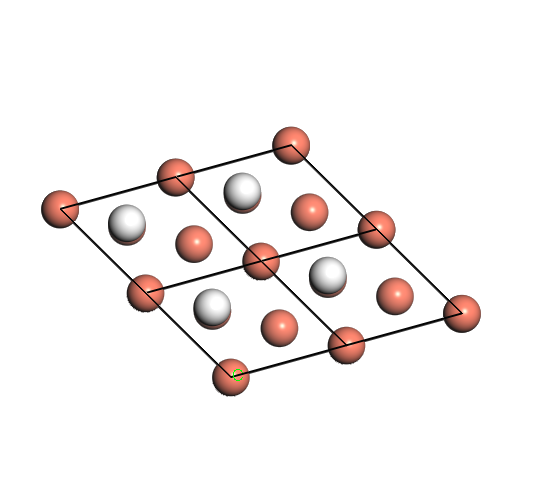
The unit cell of \(Fe_2\)\(O_3\) used Blake et al. (1970) bulk hematite structure that a=b=5.038Å, c=13.772Å, α=β=90 degrees, γ=120 degrees, and the space group is R-3c [4]. The equivalent fractional coordination in bulk hematite for iron is (0, 0, 0.35), for oxygen is (0.31, 0, 0.25). Iron occupies two-thirds of slightly distorted octahedron sites, and oxygen locates at the tetrahedron site. The Fe-O3-Fe unit repeated along the z-axis and stacked oxygens form a hexagonal close-packed (HCP) structure (Figure 1).


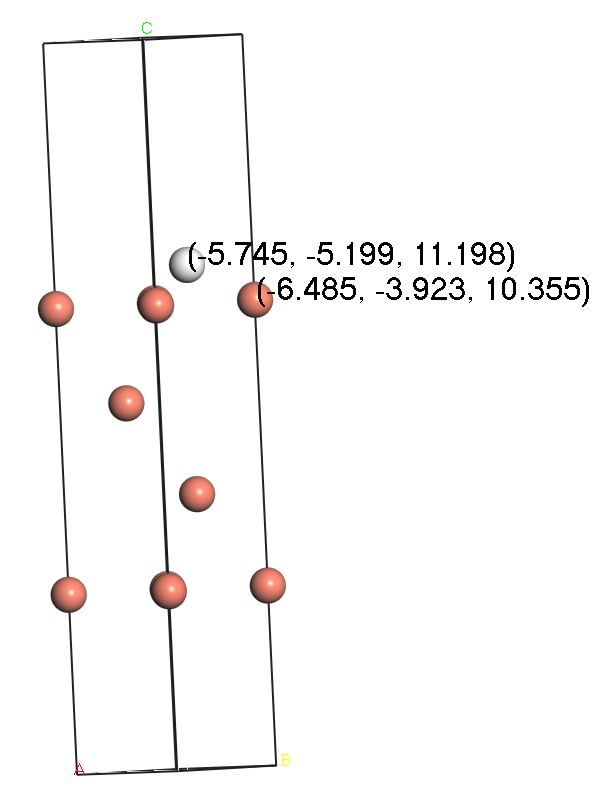
Figure 1. Crystal structure of hematite unit cell (\(Fe_2\)\(O_3\), Left) from Blake et al. (1970) and hematite 3*3*1 supercell (\(Fe_{108}\)\(O_{162}\), Right) after geometry optimization. View from the [110] direction. Red is oxygen; blue is iron.


Figure 2. FeO6 octahedron (left), and O6H3 structure (right) by removing one iron and adding three hydrogens

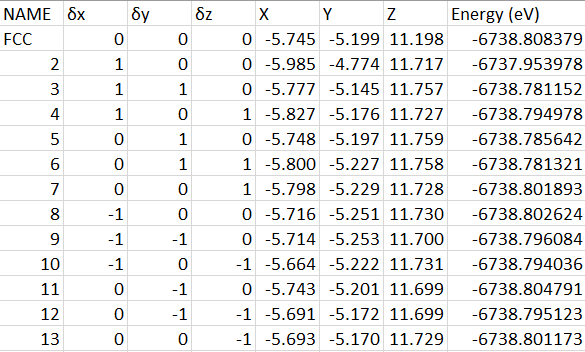
We began with modeling one iron defect (iron occupancy 0.991) in the hematite supercell (\(Fe_{108}\)\(O_{162}\)). To compensate one defective iron (Fe3+) and reach a stoichiometry in the structure, three hydrogens were modeled and bonded with three oxygens individually (Figure 2). Because the octahedron site surrounded by six oxygens is slightly distorted in hematite structure (Figure 3), the hydrogens attached to different oxygens will generate different energy. Our goal is to find the preferred oxygen position for the hydrogen to bond with by comparing the energies of 8 different configurations.

.

Figure 3. The geometry of the distorted octahedron site in hematite structure. Blue and pink atoms are iron but spin up and down respectively. Red atom is oxygen.

3. Result and Discussion

After geometry optimization and energy convergence, the energy of the 3*3*1 hematite supercell is -2002.174eV. The lattice parameters of the supercell showed that a=b=15.231Å, c=13.855Å, α=β=90 degrees, and γ=120 degrees (Figure 1). Compared to the experimental hematite structure, the computational error is 0.772%.

Figure 4. Energy convergence of configuration O 1-2-3.

The energies of eight configurations are summarized in table 1, and one of the energy convergence plots is shown in Figure 4. The lowest energy of different configurations is -2156.654eV. The most stable structure is therefore formed where hydrogens bonded with O3, O4, and O5 (Figure 5). Accordingly, the lattice parameter of this configuration is a=15.090Å, b=15.088Å, c=13.806Å, α=β=90 degrees, and γ=120 degrees. Compared to the experimental lattice parameter of hematite, the error of the computational lattice parameter is within 0.2%.

Table 1. The energy of each configuration showed that hydrogens preferred to bond with O3, O4, and O5.

Figure 5. The most stable structure for hydrogens to fit in the octahedron before (left) and after (right) geometry optimization.

The energy differences among various configurations can be caused not only by the relative atom positions but also the hydrogen bonds. The predicted OH bond length in our DFT calculation ranges from 0.93-1.0Å, which agrees with Pinney et al. (2009) [3]. For our most stable configuration O3-4-5, the OH bond length is 0.982Å (O3H), 0.991Å (O4H), and 0.992Å (O5H). Two weak hydrogen bonds are O3H—-O2 and O3H—-O1, with bond length 2.2000Å and 2.366Å respectively. One stronger hydrogen bond formed between O5H and O1, with bond length 1.824Å.


Reference

[1] Kresse and J. Furthmuller, Phys. Rev. B, vol. 54, 1996, pp. 11169-11186.

[2] P. Perdew, B. Kieron and E. Matthias, “Generalized gradient approximation made simple,” Physical review letters, vol. 77, no. 18, p. 3865, 1996.

[3] Pinney, N., Kubicki, J. D., Middlemiss, D. S., Grey, C. P., & Morgan, D. (2009). Density functional theory study of ferrihydrite and related Fe-oxyhydroxides. Chemistry of Materials, 21(24), 5727-5742.

[4] L. Blake, R. E. Hessevick, T. Zoltai and L. W. Finger, “Refinement of hematite structure,” American Mineralogist, vol. 51, p. 123, 1966.


Energy differences between hydrogen atoms absorbed on the Cu (111) fcc and hcp sites with(out) zero point energy included

1. Project Description

This project aims to calculate the vibrational frequencies and zero point energy (ZPE) of one hydrogen absorbed on face centered cubic (fcc) site and hexagonal close packed (hcp) site of Cu (111) surface. Energy calculation was performed using density functional theory (DFT) with CASTEP[1]. Exchange -correlation was treated in the generalized gradient approximation (GGA), as parameterized by Perdew, Burke, and Ernzerhof (PBE) [2]. The following valence electron configurations were employed in the potentials: 1s1 for H, and 3d10 4s1 for Cu.  Psedupotentials were used in place of other electrons, with core radii of 1.996Å  for Cu, and 0.599Å for H. The Brillouin zone integration was performed using a 9*9*1 Monkhorst-Pack k-point grid, and energy cutoff is 450eV. The SCF tolerance is 2.0e-6 eV/atom, and self-consistent dipole correction along the Z-axis is applied to the asymmetric slab.

2. Geometry optimization and energy calculation of two initial configurations

We will calculate the energies of hydrogen atoms adsorbed on two different threefold sites, the face centered cubic (fcc) site and hexagonal close packed (hcp) site, on Cu (111) surface. For each initial fcc and hcp configuration, we built four layers of Cu atom in the 10 Å slab and place one H atom near the surface (Figure 1&2).  Then we would optimize geometry with bottom three layers of Cu fixed, and both first layers of Cu and hydrogen moved freely. After geometry optimization of the structure,  the energy is calculated with the most stable relative Cu and hydrogen positions.

Figure 1. Top-down view of hydrogen atoms absorbed on FCC (Left) and HCP (Right) site of Cu (111) surface

Figure 2. Side view of hydrogen atoms absorbed on FCC (Left) and HCP (Right) site of Cu (111) surface after surface relaxation

3. Hessian Matrix

We aim to calculate the Hessian Matrix by deriving energies of various configurations with slight hydrogen displacement. Sholl and Steckel (2009) suggest a good finite-difference displacements range from 0.03-0.1Å [3]. In this project, we use finite-difference with 0.06 Å along x, y, and z direction, and energies will be calculated in 12 different configurations. The minimum energy for HCP and FCC configurations are -6738.805279 eV and -6738.808379 eV; and the atom position with minimum energy is marked with δx=δy=δz=0 (Table 1).

Table 1. Energies of displacements in HCP (Upper) and FCC (Lower) configurations, with a finite-difference of 0.06 Å

The Hassian matrix is calculated by second derivative of energies with displacement [3], for diagonal element, the Hessian matrix is calculated by:

\begin{equation} H_{ii}=(\frac{\partial^2 E}{\partial x_{i}^2}) \simeq \frac{E(x+\delta x_{i})+E(x-\delta x_{i})-2E_{0}(x)}{\delta x_{i}^2} \end{equation}

For off-diagonal element, the Hessian matrix is calculated by:

\begin{equation} H_{xy}=(\frac{\partial^2 E}{\partial x \partial y}) \simeq \frac{E(x+\delta x, y+\delta y)+E(x-\delta x, y-\delta y)-E(x-\delta x, y+\delta y)-E(x+\delta x, y-\delta y)}{4\delta x\delta y} \end{equation}

Thus the Hessian matrix for HCP and FCC configurations are:

4. Vibrational frequencies and zero point energy (ZPE) calculation

We can calculate the vibrational frequencies and zero point energy from the mass-weighted Hessian Matrix A, where the elements in the matrix A are [3]:

\begin{equation} A_{ij} = H_{ij} / m_i \end{equation}

The eigenvectors e and eigenvalues λ of matrix A satisfy Ae = λe. And vibrational frequencies νare obtained from the eigenvalues λi of the matrix product A[3],

\begin{equation} \nu_i = \sqrt{\lambda}/2\pi \end{equation}

Thus the eigenvalues and vibrational frequencies of the HCP and FCC mass-weighted Hessian matrix are (Table 2):

Table 2. The calculated eigenvalue and frequencies in HCP and FCC configurations

and zero point energy (ZPE) is obtained by [3]:

\begin{equation} E_{ZPE} = \Sigma_i \frac{ h \nu_i}{2} \end{equation}

Thus the zero point energy of HCP and FCC configurations are 0.175347eV and 0.623748eV.

5. Conclusion

The energies are summarized in Table 3. The energy differences between HCP and FCC configurations without ZPE are 0.003100eV, with ZPE are -0.445301eV. That’s to say, Without including ZPE, hydrogen on the FCC site has a lower energy than HCP sites (0.003100eV), which means hydrogen in FCC site is more stable. With ZPE included, hydrogen on the FCC site has a higher energy than HCP (0.445301eV), which means HCP site is more forved. Therefore, light atoms, such as hydrogen, should consider the influence of the zero point energy.

Table 3. A summary of energy with(out) ZPC when hydrogen absorbed on HCP and FCC sites.


Reference

[1]. S. J. Clark, M. D. Segall, C. J. Pickard, P. J. Hasnip, M. J. Probert, K. Refson, M. C. Payne, “First principles methods using CASTEP”, Zeitschrift fuer Kristallographie 220(5-6) pp. 567-570 (2005)

[2]. J. P. Perdew, K. Burke and M. Ernzerhof, “Generalized gradient approximation made simple”. Phys. Rev. Lett. 77, 3865 (1996).

[3]. Sholl, D. S., & Steckel, J. A. (2009). What is density functional theory? (pp. 1-33). John Wiley & Sons, Inc.


Surface relaxiation of (0001) face in hematite

Introduction

This project aims to study the (0001) surface relaxation of hematite, including determining a suitable surface size and thickness for surface energy calculation. Density Functional Theory (DFT) calculations for hematite surface geometry optimization were performed using the Perdew-Burke-Ernzerh [1] of generalized gradient approximation for the exchange-correlation functional in the DMol3 code [2]. The Monkhorst -Pack k-point grid in this calculation is determined by the convergence of the free energy of bulk hematite. The slab thickness is chosen when the atomic layer in the center of the slab remains the same after DFT calculation.

Hematite Crystal structure

This project uses energy converged hematite (α-Fe2O3) structure with lattice parameter a=b=5.05Å, c=13.81Å, α=β=γ=90 degrees, and space group R-3c [3]. The equivalent fractional coordination in bulk hematite for iron is (0, 0, 0.353694), for oxygen is (0.3059, 0, 0.25). Iron occupies two-thirds of slightly distorted octahedron sites, and oxygen locates at the tetrahedron site. The Fe-O3-Fe unit repeated along the z-axis and stacked oxygens form a hexagonal close-packed (HCP) structure (Figure 1).

Figure 1. The structure of hematite, with its space group R-3c. Oxygens (red) stacked hexagonal close-packed, and irons (blue) locate at two-thirds of the octahedron site.

Construction of (0001) Surface

Former research shows that surface (0001) in hematite react to water and metal legends actively. The (0001) surface of the hematite model was built with half-infinite slabs, ten atomic layers, and 10Å vacuum. Choosing symmetric slab reduces the generated dipole between uppermost and button layer. The thickness of the slab should be large enough to ensure the surface is enough for relaxation. In this calculation, we use ten atomic layers to relax the surface atom. The distances between O-Fe and Fe-Fe atomic layers are shown in Figure 2. Due to the distorted octahedra site in hematite structure, the irons are not in the same atomic plane and thus regarded as in two different planes with their distance of 0.607Å.

Figure 2. Ten atomic layers present with (0001) cleaved surface, blue is iron and red is oxygen.


(0001) Surface relaxation result

The slab thickness can only be chosen if the atomic positions at the center of the slabs retain the same with bulk coordinates. A DFT-optimized 1*1 surface geometry optimization was calculated initially using a 5*5*1 Monkhorst-Pack k-point grind and 4.5Å global orbital cutoff [4]. The core treatment for iron and oxygen atoms is applied to all electrons. The energy convergence and SCF tolerance are 1.0e-5 Hartree eV and 1.0e-6 eV separately. The maximum force applied on each atom is 0.002 Ha/Å, and maximum displacement for each atom is 0.05 Å. Figure 3 shows iron and oxygens coordination after relaxation. The relaxed layer-1 oxygen anions have moved 2.21% to the positive z-direction from their bulk positions; the relaxed layer-2 iron has moved 1.31% to the negative z-direction from the bulk positions. The distance of first two layers and last two layers showed a contraction from 0.847 Å  to 0.688 Å (Figure3). Moreover, the oxygen in the first layer moved not only along z axis but also along x and y axis to relax the surface energy (Figure4).

Figure 3. DMol3 calculation with K-point set 5*5*1

Figure 4. A comparison of first layer oxygen original coordinates (left) and after surface relaxation (right). Oxygen in the first and last layer changed all their coordinates to relax surface energy.

The energy decreased and converged as the atoms find their preferred location (Figure 5). The  total energy of using 5*5*1 and 6*6*1 k-points is -8483.9002004eV and -8483.900402eV. This geometry optimization calculation shows the coordination of the center of the atom layer (layer 5-6, Fe-Fe layer) changed swiftly than in bulk after calculation, suggesting this model required larger suitable slab size for geometry optimization. But we get similar total energy and percent realization using 5*5*1 and 6*6*1 k-points, showing that the k-point is suitable for the geometry optimization (Table 1). 

Figure 5. Energy convergence in geometry optimization, giving a result of -8483.900402 eV using 6*6*1 k-point

Table 1. DMol3 geometry optimization result and percent relaxation of surface (0001)  with k-point 5*5*1

Conclusion

In this project, the slab was built symmetrically with a 10Å vacuum. The Brillouin zone integrated with a 5*5*1 Monkhorst-Pack k-point grid. The global orbital cutoff is set as 4.5Å. However, the slab in this calculation is not enough to relax the (0001) surface within ten atomic layers because the center layer of the atoms moved too much after DFT calculation. A good indication of surface relaxation is the atom position of the center remaining the same after relaxation while a first and last couple of layers are relaxed.


Reference

[1] Perdew, J. P., Burke, K., & Ernzerhof, M. (1996). Generalized gradient approximation made simple. Physical review letters, 77(18), 3865.

[2] Delley, B. (2000). From molecules to solids with the DMol 3 approach. The Journal of chemical physics, 113(18), 7756-7764.

[3] Trainor, T. P., Chaka, A. M., Eng, P. J., Newville, M., Waychunas, G. A., Catalano, J. G., & Brown Jr, G. E. (2004). Structure and reactivity of the hydrated hematite (0 0 0 1) surface. Surface Science, 573(2), 204-224.

[4] Lo, C. S., Tanwar, K. S., Chaka, A. M., & Trainor, T. P. (2007). Density functional theory study of the clean and hydrated hematite (1 1¯ 02) surfaces. Physical review B75(7), 075425.


Determination of the Lattice Parameter of ScAl in the CsCl Structure

This Project aims to predict the lattice constant of ScAl with CASTEP calculation.

A. Project Description 

In this study, we focus on predicting the lattice constant of  ScAl based on the CsCl structure, and figuring out a converged energy cutoff and k-points in the CASTEP energy calculation. Atomic electron configuration for Al is 3s2 3p1, for Sc is 3s2 3p6 3d1 4s2. The energy calculation in CASTEP can provide a reasonable crystal structure for ScAl. The energy calculation in this study is based on the exchange correlation Perdew-Burke-Ernzerhof (PBE) density functionale, which is from the class of Generalized gradient approximation (GGA) functional. The relationships between energy and lattice parameters, energy cutoff, and k-points are discussed below.

B. Crystal Model

ScAl has CsCl structure, where Scandium (Sc) locates at the corner and Aluminum (Al) in the center of the unit cell. This structure belongs to the cubic system, the lattice parameter a=b=c, α=β=γ=90 degrees.

The cell vectors are along x, y, direction of the unit cell, with orthogonal \(a_i\) (1,0,0), \(a_j\)(0,1,0), and \(a_k\)(0,0,1) respectively. The equivalent fractional coordinate of the Sc is (0,0,0) whereas the Al is (1/2, 1/2, 1/2). The real coordinates of Sc and Al in the unit cell depend on the lattice parameter a, with Sc at (0,0,0), (a,0,0), (0,a,0), (0,0,a), (a,a,0), (a,0,a), (0,a,a), and (a,a,a); Al at (a/2,a/2,a/2). Figure 1 shows an example of Sc and Al positions with the lattice parameter a=b=c=3.379 Å.

Figure 1. Simple cubic structure of ScAl, where Aluminum locates in the center and Scandium in the corner of the unit cell.

C. Determine the Lattice Parameters of ScAl

In order to predict a reasonable lattice parameter of ScAl, the energy of the unit cell is calculated with the variation on lattice parameters. Given the structure is from the cubic system, the lattice parameters a, b, and C are equal and will be referred to “a” as below. Before the calculation, the lattice parameter a is estimated based on the atomic radius of Al (1.43 angstrom) and Sc (2.30 angstrom). To get a well packed structure along the body diagonal in (111) face, the lattice parameter should be smaller than 2(r(Al)+r(Sc))/√3, which is 4.3 Å.

As a starting point the energy of the ScAl structure was calculated witha lattice parameter of  4.3Å using the CASTEP calculation ( Energy cutoff 500 eV, k-points 10*10*10). With the decreased lattice parameter from the starting point, the free energy of the unit cell reached a minimum to some point and then increased with the lattice parameter decreased further (Figure 2). This shape of curve is caused by the relative atom positions, either too far or too close, generateing higher energy (less stable structure) than the minimum energy (the most stable structure by calculation). The lattice parameter \(a_0\)= 3.379 Å corresponds the minimum cohesive energy (Figure 2).

Figure 2. Cohesive energy for simple cubic ScAl, using 10*10*10 kpoints and 500eV energy cutoff, as a function of lattice parameter


D. The Energy Cutoff

Multiple calculations for ScAl structure were completed with a variation of energy cutoff \(E_{cut}\) from 200eV to 800eV. Lattice parameter and kpoints remained the same at 3.379 Å and 8*8*8 k-point grid for Brillouin zone integration respectively. An increase in the energy cutoff increases the number of plane-waves and improves the accuracy of ion cores, but costs longer computation time. Repeated calculations with higher energy cutoff aim to converge to a decent final free energy (Figure 3&4). Convergence is reached with an energy cutoff of 500eV providing an accuracy of the absolute energy better than 0.001eV (Figure 4).

Figure 3. Both Al and Sc atomic energy converged at 500eV with a lattice parameter 3.379 Å and 8*8*8 k-point grid for Brillouin zone integration.
Figure 4. Energy per cell and cohesive energy of ScAl as a function of energy cutoff with a lattice parameter 3.379 Å and 8*8*8 k-point grid for Brillouin zone integration.

The cohesive energy of a solid material is the energy to separate the condensed material into isolated free atoms.

\begin{equation}E_{coh}=(E_{total}-E_{atom})/N\end{equation}
with \(E_{total}\)is the total energy of the unit cell, \(E_{atom}\) is the total energy of the atom, and N as the number of atoms in the unit cell. Table 1 and Figure 4 indicate that the cohesive energy decreased with higher energy cutoff, converged to an accuracy of  0.01eV at energy cutoff of 500eV.

Table 1 Results from computing the total energy, atomic energy, and cohesive energy of simple cubic ScAl with 8*8*8 kpoints in different energy cutoffs


E. k-points

As k-point varied but energy cutoff (500 eV) and lattice parameter (3.379 Å) unchanged in the following calculation, the total energy of the cell converged with more kpoints.  The cell volume and atomic energy remained the same, because the cell volume only depends on lattice parameter and atomic energy depends on the energy cut-off.

Figure 5. Energy per cell and cohesive energy of ScAl as a function of M*M*M k-points, with a lattice parameter 3.379 Å and energy cutoff 500eV.

The used k points are reduced by symmetry operations using Monkhorst-Pack approach with M*M*M k points in ScAl cubic structure. Table 2 and Figure 5 shows the number of k poins in irreducible Brillouin zone (IBZ) and correspondent total energy and binding energy. Both the odd (2n+1) and even (2n+2) values of M have the same number of k points in IBZ, but even values (2n+2) of M converges better than odd values in regard to the same computational time. In our cases, both the 7*7*7 and 8*8*8 k points required 8.08 seconds to finish the calculation, but 8*8*8 converging better because all k points are inside of the IBZ (Sholl and Steckel, 2011). In ScAl structure, 12*12*12 k points are enough to get accurate energy.

Table 2 Energy calculation with k points varies, energy cutoff 500eV, lattice parameter 3.379 Å.


Conclusion:

The total energy of simple cubic ScAl minimized at lattice parameter a=3.379 Å. Energy per cell converges when energy cutoff is 500eV, k-points are 12*12*12.


Reference

[1] Sholl, D. and Steckel, J.A., 2011. Density functional theory: a practical introduction. John Wiley & Sons.

[2] BIOVA, 2014. CASTEP guide , Material Studio. http://www.tcm.phy.cam.ac.uk/castep/documentation/WebHelp/content/pdfs/castep.htm