Author Archives: Zihao Chen

Thermodynamic ab initio Study for Coverages of Adsorbed H on Cu(100)

Introduction

When H atoms are adsorbed on Cu(100), the coverages of these atoms are determined by the chemical potential of hydrogens. In order to gain better understanding of such behavior, we will carry out a thermodynamic ab initio study in this project. We will firstly start from the calculations of the energy of bulk Cu as well as gas-phase hydrogen atom. The energy of the adsorption system with different coverages of H atoms will then be calculated. Convergence tests with respect to energy cutoff and k-point sampling will be performed for each calculation.

The Vienna Ab initio Simulation Package (VASP) is used to perform all the periodic density functional theory (DFT) calculations,1-3employing the projected augmented-wave (PAW) pseudopotentialsand the generalized gradient approximation with exchange-correlation functional by Perdew, Burke, and Ernzerhof (PBE).4-6The conjugated gradient algorithm is chosen to perform the geometric optimization in VASP. For all the calculations in this project, the dipole correction along z-axis is included and the dispersion correction method of Grimme is introduced to better describe the interaction between H atoms and Cu surfaces.7


Bulk Cu and Gas-Phase Hydrogen

The unit cell with one Cu atom in it is constructed to calculate the energy of bulk Cu (the energy of one Cu atom in bulk phase) as shown below in Figure 1. The lattice vectors are (0.5, 0.5, 0.0), (0.0, 0.5, 0.5), and (0.5, 0.0, 0.5). The lattice constant is chosen to be the experimental value of 3.615 Å.

Figure 1: Unit cell of bulk Cu


According to the previous calculation on fcc bulk metal using the same unit cell, the k-point sampling of 15x15x15 will give the accuracy within 0.01 eV and here we use the sampling of 21x21x21 to test the energy cutoff. The results for the convergence tests are shown below in Table 1.

Energy Cutoff (eV)

400 450 500 550 600 650
Bulk Energy (eV) -4.1428 -4.1410 -4.1414 -4.1417 -4.1416

-4.1417

Table 1. Convergence of energy cutoff


Here we can see that, the energy cutoff of 500.00 eV can give us the accuracy of 0.0003 eV and this energy cutoff will be used for the following calculations (the energy cutoff for H should be much lower than Cu, so the 500.00 eV energy cutoff is appropriate for H).

The energy of gas-phase hydrogen atom is calculated using a cubic box with side length of 25.0 Å and the energy is -6.77 eV and the energy for one H atom is thus -3.385 eV.


Adsorption of H atoms on Cu(100)

In order to calculate the adsorption of H on Cu(100), a six layer slab model is used to model the Cu surface. The bottom three layers are fixed at bulk position with lattice constant of 3.615 Å and the upper three layers along with the H atoms are fully relaxed during the geometry optimization. For the 1/9 ML coverage, a supercell of 3×3 is used with one H atom on it, while the 2×2 supercell is used for the 0.25 ML and 0.50 ML coverages with one and two H atoms on it, respectively. The 1×1 unit cell is used for the 1ML coverage.

Before we carry out the calculations of these adsorption system, we have to firstly determine the adsorption site of H atoms on Cu(100). Here We choose the Cu(100)-3×3 supercell with three different initial adsorption sites, including atop, bridge, and hollow, to study the energy-favored adsorption site. The energy cutoff of 500.00 eV and sampling of 6x6x1 are used here (whose convergence has not been teste but reliable for comparisons between several rough geometry optimizations). The optimized surfaces are shown below in Figure 2.

Figure 2: Binding conformation of H atoms at different sites, from left to right: atop, bridge and hollow, only the upmost layer is shown here.


The system energies are -213.132, -213.603, and -213.736 eV for the atop, bridge, and hollow cases, respectively. So we can see, the hollow site is most energy favored and will be chosen as the initial sites for the later calculations.

The convergence tests with respect to the k-point sampling on these three supercells (1×1, 2×2, and 3×3) are summarized below in Table 2.

1×2 17x17x1 19x19x1 21x21x1 23x23x23
Energy (eV) -26.861 -26.864 -26.864 -26.866
2×2 7x7x1 8x8x1 9x9x1 10x10x1 11x11x1 13x13x1
Energy (eV) -96.941 -96.998 -96.963 -96.987 -96.981 -96.985
3×3 5x5x1 6x6x1 7x7x1 8x8x1 9x9x1 11x11x1
Energy (eV) -213.760 -213.736 -213.729 -213.711 -213.710 -213.711

Table2: Summary of convergence tests on k-point samplings


The k-point sampling for these three supercells are chosen to be 19x19x1, 11x11x1, and 9x9x1 to provide an accuracy of 0.006 eV. The system energies used for the later ab initio calculations are -26.864, -96.981, and -213.710, respectively.


Thermodynamic ab initio calculations

In order to find the equilibrium points (with respect to the chemical potential of H atom) between different coverages (In this project, 0.00 ML, 0.11 ML, 0.25 ML, 0.50 ML and 1.00 ML are considered), we define the normalized grand potential for each coverage as:

\begin{equation} \Omega_{i}(\mu_{H}) = \frac{E_{i}(N_{Cu, i}, N_{H, i})-\mu_{H}\times N_{H, i}-\mu_{Cu}\times N_{Cu,i}}{N_{Cu,i}} \end{equation}

Thus, we can have the grand potential diagram to show the potential-dependent coverages of H atoms on Cu(100). The grand potential diagram are shown below in Figure 3. The x-axis is the chemical potential difference while the DFT energy for H atom is used as the reference. The range of x-axis is [-2.7, -2.2], as the bare Cu(100) will be preferred at lower chemical potential out of this range and the 1.00 coverage case will be preferred at higher chemical potential out of this range. The four equilibrium points are -3.6074, -3.5983, -3.5301, and -3.4721 eV.

Figure 3: Grand potential vs chemical potential of H atoms


To have a clearer understand of such grand potential diagram, we further reduce the x-range to [-2.6, -2.3] and only keep lines which have the minimal grand potential at each different chemical potential of H atoms as shown below in Figure 4, which allows us to learn the potential-dependent coverages of H atoms on Cu(100).

Figure 4: Minimal grand potential at different chemical potential of H atoms

To get the phase diagram, we calculate the \ln{p/p^o} according to the equation (2) as listed below, while \tilde{\mu}_{H_2}(T, p^o) in that equation is obtained from equation (3). All the data are acquired from NIST.8

\begin{equation}\ln{p/p^o}=\frac{1}{k_B T} (\mu_{H_2}-E_{H_2}^{DFT}-\tilde{\mu}_{H_2}(T, p^o))\end{equation}

\begin{equation}\tilde{\mu}_{H_2}(T, p^o)=[H(T)-H^o(T_r)]-TS(T)-[H(0)-H^o(T_r)]\end{equation}

The phase diagram is shown below in Figure 5.


Reference

  1. Kresse, G. and J. Hafner,Ab initio molecular dynamics for liquid metals.Physical Review B, 1993. 47(1): p. 558.
  2. Kresse, G. and J. Hafner,Ab initio molecular-dynamics simulation of the liquid-metal–amorphous-semiconductor transition in germanium.Physical Review B, 1994. 49(20): p. 14251.
  3. Kresse, G. and J. Furthmüller, Efficient iterative schemes for ab initio total-energy calculations using a plane-wave basis set.Physical review B, 1996. 54(16): p. 11169.
  4. Kresse, G. and D. Joubert, From ultrasoft pseudopotentials to the projector augmented-wave method.Physical Review B, 1999. 59(3): p. 1758.
  5. Blöchl, P.E., Projector augmented-wave method.Physical review B, 1994. 50(24): p. 17953.
  6. Perdew, J.P., K. Burke, and M. Ernzerhof, Generalized gradient approximation made simple.Physical review letters, 1996. 77(18): p. 3865.
  7. Grimme, S., Semiempirical GGA-type density functional constructed with a long-range dispersion correction. Journal of computational chemistry, 2006. 27(15): p. 1787-1799.
  8. Stull, Daniel Richard, and Harold Prophet. JANAF thermochemical tables. No. NSRDS-NBS-37. National Standard Reference Data System, 1971.


Zero Point Energy Correction of H adsorbed on Cu(111)


1. Problem Description

In this project, the zero point energy (ZPE) correction of one hydrogen atom adsorbed at two different hollow sites of Cu(111) was studied.

In order to get the zero point energy, we firstly initiated the geometry optimization to find the optimal conformation of H adsorbed on Cu(111) as a stating point, by putting the H atom at the fcc-hollow site and hcp-hollow site above the surface for about 2.0 Å. Then, to get the weighted Hessian matrix required to calculate the vibrational frequencies, the H atom was displaced with a step size of 0.05 Å or 0.10 Å along the x, y, and z direction and the corresponding energies were calculated. Different displacements were tested to confirm the correct ZPE. The weighted Hessian matrix consists of the second order derivatives of energies with respect to the displacement along different directions, multiplying the weighted factor. After that, the vibrational frequencies could be found by diagonalizing the Hessian matrix and thus, the ZPE was calculated to correct the binding energy of H at different sites.


2. Computational Method

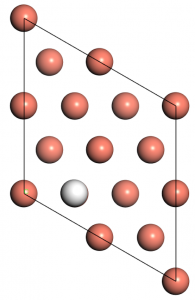
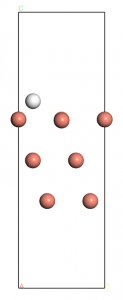
The surface was cleaved from bulk Cu using Materials Studio along the <111> direction with three layers included. In order to minimize the interactions between periodic images of H atoms, we chose to construct a (2×2) supercell including 10 Å of vacuum space as shown in Figure 1. H atom was initially located at two different hollows site above the surface. During the geometry optimization, the upmost layer along with the H atoms were allowed to move while the bottom two layers were totally fixed at the bulk position. After the geometry optimization, the single point calculations were performed to calculate the energy with different displacement of the H atom.


Figure 1. Top-down view and side view of the Cu(111)-2×2 supercell


All the calculations were carried out using CASTEP with Materials Studio and the GGA-PBE was chosen to be the exchange-correlation functional. The pseudopotential was solved with the Koelling-Harmon atomic solver and the valence electrons were 3d10 4s1 and 1s1 for Cu and H, respectively. The energy cutoff of 408.2 eV and the k-point sampling of 6x6x2 were used. The energy cutoff and k-point sampling were tested to give a convergence within 0.02 eV. The results of convergence tests are summarized below in Table 1. The convergence criteria for force and energy were 0.02 eV/ Å and 10e-6 eV, respectively. The self-consistent dipole correction along the Z-axis was also introduced to better describe the adsorption of the H atom.

Energy Cutoff (eV) 400 408.2 410 420
Energy (eV) -20182.9745 -20183.1051 -20183.1281 -20183.1374
K-point 5x5x2 6x6x2 7x7x2 8x8x2
Energy (eV) -20183.0103 -20183.1051 -20183.0376 -20183.1224
Vacuum Space (Å) 10 11 12 13
Energy (eV) -20167.1164 -20167.1163 -20167.1157 -20167.1148

Table 1: Summary of convergence tests


3. ZPE at FCC-Hollow Site

As the only atom displaced is H in our system, there weighted Hessian matrix can be easily achieved by multiplying a factor to the Hessian matrix. In order to construct the Hessian matrix for vibrational frequency, the H atom should be displaced along the x, y, and z direction with an appropriate step size to calculate the second derivatives of energies with respect the movements.

For the diagonal elements in the Hessian matrix, the second derivative was calculated using three points as shown below in equation 1, while for the off-diagonal elements, it was calculated using four points as in equation 2.

\begin{equation} H_{ii} \cong \frac{E(\delta x_{i})+E(-\delta x_{i})-2E_{0}}{\delta x_{i}^2} \end{equation}
\begin{equation} H_{ij} \cong \frac{E(\delta x_{i}, \delta x_{j})+E(-\delta x_{i},-\delta x_{j})-E(\delta x_{i}, -\delta x_{j})-E(-\delta x_{i}, \delta x_{j})}{4\delta x_{i}\delta x_{j}} \end{equation}


Here,  dxi represents the displacement in the i direction (can be along x, y, and z direction) and  E0 is the minima energy.

In this project, the step size of 0.05 Å and 0.10 Å were both applied in order to ensure that the displacements were appropriately chosen. Due to the symmetry, there were in total 18 sets of energies of different displacements required and the results for H atom at fcc-hollow site with different step sizes are summarized below in Table 2.

Displacement Direction Energy (eV)
X Y Z Step size = 0.05 Å Step size = 0.10 Å
0 0 0 -20183.1051 -20183.1051
1 0 0 -20183.1017 -20183.0910
-1 0 0 -20183.1022 -20183.0943
1 1 0 -20183.0991 -20183.0829
-1 -1 0 -20183.0986 -20183.0773
1 -1 0 -20183.0995 -20183.0841
-1 1 0 -20183.0987 -20183.0779
1 0 1 -20183.0970 -20183.0760
-1 0 -1 -20183.0970 -20183.0704
1 0 -1 -20183.0962 -20183.0647
-1 0 1 -20183.0972 -20183.0777
0 1 0 -20183.1020 -20183.0929
0 -1 0 -20183.1022 -20183.0933
0 1 1 -20183.0970 -20183.0767
0 -1 -1 -20183.0967 -20183.0678
0 1 -1 -20183.0967 -20183.0857
0 -1 1 -20183.0974 -20183.0684
0 0 1 -20183.0996 -20183.0848
0 0 -1 -20183.1004 -20183.0776

Table 2: Summary of energies with different displacements


According to the equations above, we were able to calculate the elements in the Hessian matrices as well as the eigenvalues these matrices. Thus, the zero point energy can be calculated using the equation 3 and 4 as show below.

\begin{equation} \nu_{i} = \frac{\sqrt{\lambda_{i}}}{2\pi} \end{equation}
\begin{equation} E_{ZPE} = \frac{h\nu_{i}}{2} \end{equation}


Here,  vi is the vibrational frequency and  lambda is the eigenvalue of the Hessian matrix and h is the Planck’s constant.

For the displacements with step size of 0.05 Å, the weighted Hessian matrix is

\begin{bmatrix} 2.412\times10^{28} & 4.786\times10^{26} & -5.744\times10^{26} \\ 4.786\times10^{26} & 2.297\times10^{28} & 3.829\times10^{26} \\ -5.744\times10^{26} & 3.829\times10^{26} & 3.906\times10^{28}\end{bmatrix}

The eigenvalues are 3.90907327e+28, 2.42876582e+28, and 2.27843185e+28. Corresponding zero point energies are 0.130 eV, 0.102 eV, and 0.099 eV.

For the displacements with step size of 0.10 Å,  the weighted Hessian matrix is

\begin{bmatrix} 2.383\times10^{28} & 4.308\times10^{26} & -9.573\times10^{26} \\ 4.308\times10^{26} & 2.297\times10^{28} & 3.590\times10^{26} \\ -9.573\times10^{26} & 3.590\times10^{26} & 3.800\times10^{28}\end{bmatrix}

The eigenvalues are 3.80789093e+28, 2.39781505e+28, and 2.27653408e+28. Corresponding zero point energies are 0.128 eV, 0.102 eV, and 0.099 eV.

We can see that these two different choices bring us similar ZPE with differences less than 2%, which means that our choice of step size of the displacement is appropriate. To sum up, based on the results of 0.10 Å, the total ZPE for H atom at the fcc-hollow site is 0.329 eV. The corresponding eigenvectors are [-0.06640341, -0.91052413, -0.40808872], [0.02181974, -0.41021872, 0.91172611], and [0.99755425, -0.05163733, -0.04710732].


4. ZPE at HCP-Hollow Site

Similarly, we carried out the calculations by initially locating the H atom at the hcp-hollow site. Accordingly, the results for H atom at hcp-hollow site with different step sizes are summarized below in Table 3.

Displacement Direction Energy (eV)
X Y Z Step size = 0.05 Å Step size = 0.10 Å
0 0 0 -20183.0973 -20183.0973
1 0 0 -20183.0948 -20183.0874
-1 0 0 -20183.0937 -20183.0830
1 1 0 -20183.0913 -20183.0708
-1 -1 0 -20183.0912 -20183.0753
1 -1 0 -20183.0915 -20183.0718
-1 1 0 -20183.0916 -20183.0766
1 0 1 -20183.0897 -20183.0703
-1 0 -1 -20183.0881 -20183.0560
1 0 -1 -20183.0895 -20183.0631
-1 0 1 -20183.0889 -20183.0678
0 1 0 -20183.0945 -20183.0859
0 -1 0 -20183.0944 -20183.0857
0 1 1 -20183.0895 -20183.0697
0 -1 -1 -20183.0890 -20183.0607
0 1 -1 -20183.0889 -20183.0602
0 -1 1 -20183.0893 -20183.0692
0 0 1 -20183.0917 -20183.0768
0 0 -1 -20183.0925 -20183.0774

Table 3: Summary of energies with different displacements


For the displacements with step size of 0.05 Å, the weighted Hessian matrix is

\begin{bmatrix} 2.317\times10^{28} & 5.505\times10^{26} & 1.101\times10^{26} \\ 5.505\times10^{26} & 2.202\times10^{28} & -2.393\times10^{26} \\ 1.101\times10^{26} & -2.393\times10^{26} & 3.868\times10^{28}\end{bmatrix}

The eigenvalues of this Hessian matrix are 3.98502936e+28, 2.35385631e+28, and 2.16250165e+28. The corresponding zero point energies are 0.131 eV, 0.101 eV, and 0.097 eV.

For the displacements with step size of 0.10 Å, the weighted Hessian matrix is

\begin{bmatrix} 2.336\times10^{28} & 5.744\times10^{26} & 5.744\times10^{26} \\ 5.744\times10^{26} & 2.183\times10^{28} & 2.872\times10^{26} \\ 5.744\times10^{26} & 2.872\times10^{26} & 3.983\times10^{28}\end{bmatrix}

The eigenvalues of this Hessian matrix are 3.87576398e+28, 2.33336757e+28, and 2.17737216e+28. The corresponding zero point energies are 0.130 eV, 0.101 eV, and 0.097 eV. 

We can see that these two different choices bring us similar ZPE with differences less than 2%, which means that our choice of step size of the displacement is appropriate. To sum up, based on the results of 0.10 Å, the total ZPE for H atom at the fcc-hollow site is 0.328 eV. The corresponding eigenvectors are [-0.07002192, -0.91680843, 0.39314022], [0.01196003, -0.39485082, -0.9186674 ], and [-0.99747375, 0.05962489, -0.03861327].


5. Summary

The energies of Cu slab with the H atom adsorbed at different sites before and after ZPE correction are summarized below in Table 4.

Energy (eV) ZPE(eV) Energy with ZPE (eV)
FCC-Hollow -20183.1051 0.3297 -20182.7754
HCP-Hollow -20183.0973 0.3273 -20182.7701
Difference 0.0078 0.0024 0.0053

Table 4. Summary of ZPE at different sites


We can see that ZPE is significant for the H atom adsorbed on Cu(111) but the ZPE at different hollow sites are quite similar. The differences of the total energy with and without ZPE at different sites are both within 0.01 eV, which is very small and the adsorption energy of the H atom at these two sites are almost the same. However, such a small binding energy difference is within the range of convergence error, which means that we cannot decide which site is preferred.

Reference

  1. Clark, Stewart J., et al. “First principles methods using CASTEP.” Zeitschrift für Kristallographie-Crystalline Materials 220.5/6 (2005): 567-570.
  2. Perdew, J.P., K. Burke, and M. Ernzerhof, Generalized gradient approximation made simple. Physical review letters, 1996. 77(18): p. 3865.

Determination of the Optimal Structure of Water and Hydrogen Cyanide

1. Problem Description

In this project, we aim to predict the optimal structures of H2O and HCN using DFT. To calculate the energy of an isolated molecule with periodic supercells, the molecule is placed in a large enough cubic supercell to minimize the influence from period images. To perform the geometric optimization, we need to take all the internal degrees of freedom like bond lengths and bond angles into consideration with appropriate stopping criterions for energy and force. We start from various initial structures with all degrees of freedom included to see if they will finally converge to the same structure to ensure that we reach the optimal structures.

The Vienna Ab initio Simulation Package (VASP) is used to perform periodic DFT calculations,1-3 employing the projected augmented-wave (PAW) pseudopotentials and the generalized gradient approximation with exchange-correlation functional by Perdew, Burke, and Ernzerhof (PBE).4-6 The conjugated gradient algorithm is chosen to perform the geometric optimization in VASP.

2. H2O Structure

Before we can perform the geometric optimization of H2O, convergence tests are required firstly with respect to the size of the unit cell as well as the energy cutoff. The test for number of k-points is not required here because all the calculations for such geometric optimization of one molecule in a large box use a 1x1x1 k-point sampling. For both H2O and HCN, all three atoms lie in one plane. In order to do the convergence test, we initially put the O atom at the (0, 0, 0) and two H atoms at (1/L, 0, 0) and (-1/L, 0, 0) according to the experimental results (H-O bond length usually around 1 Å) as shown in Figure 1 (L is the side length of the unit cell).

Figure 1. H2O in a large box (H2O is located at the vertex of the cubic unit cell)


Energy cutoffs ranging from 400.00 to 600.00 eV are used and the side length of the cubic unit cell is chosen from 20.0 to 30.0 Å with an increment of 1 Å. The results of the convergence tests are summarized below in Table 1-2 and Figure 2-3.

Table 1. Convergence tests on energy cutoff for H2O

Table 2. Convergence tests on unit cell size for H2O

Figure 2. Energy vs energy cutoff for H2O                  Figure 3. Energy vs unit cell size for for H2O

Based on these results, we chose the energy cutoff of 500.00 eV (tolerance of 0.005 eV) and the side length of 25.0 Å for further calculation of the water molecule.

Now, we firstly vary the bond length between H and O atoms while still keeping them linearly arranged on the y-axis. The O atom remains (0, 0, 0) and the two H atoms are located at (a/L, 0, 0) and (-a/L, 0, 0). Here, L=25.0 Å and a is chosen from 0.5 to 1.3 Å with the interval of 0.1 Å. The results are summarized below in Table 3.

Table 3. Results for H2O with different initial bond lengths


From these results, we can see that the energies for the cases with initial bond lengths of 0.5 and 0.6 Å are significantly higher as the distances between atoms in the optimal geometry, which are trapped in a local minimum, are much larger than typical bond lengths as shown in Figure 4. The distances between the O atom and the H atom are 9.790 and 4.809 Å for these two cases, respectively. As two H atoms are initially too close to the O atom, this situation physically represents the enormously compressed bonds, which brings a strong repulsive force pushing the atoms away from each other. The numerical optimization method then takes an initial step that separates the two atoms by a very large distance and they can never go back since the force is much weaker now due to the very large distance. All other cases give us the same optimized structure as shown in Figure 5. The H-O bond length is 0.943 Å and the bond angle qHOH is 180.00°.


Figure 4. Separated H2O with initially short distances   Figure 5. Optimized structure for H2O


In order to ensure that the structure above is the optimal structure, we modify the initial structure through changing the bond angle that does not make components of the forces vanished by symmetry. So, with the O atom remaining at (0, 0, 0), the two H atoms are at (a/L, b/L, 0) and (-a/L, b/L, 0). L here is the side length of 25.0 Å, and according to the results above, the a is fixed at 0.9 Å while b is chosen from 0.1, 0.2, and 0.3 Å to have three different initial bond angles. After optimization, we find that these three tests finally converge at the same free energy of -14.217 eV with the same optimized structure of H2O as shown in Figure 6. The H-O bond length is 0.972 Å and the bond angle qHOH is 104.50°. The energy is lower than the previous cases with bond angle of 180.00° and since three different bond angles finally converges to the same structure, this is the optimal structure for H2O. The experimental H-O bond length and bond angle is 0.958 Å and 104.48°, respectively. We see that the DFT-predicted bond length and bond angle are very similar to the experimental results with differences less than 2%.

Figure 6. Optimal structure for H2O


3. HCN Structure

Similarly, the convergence tests are required before we optimize the structure HCN. Due to the similar size of these two molecules, the convergence test on unit cell sizes is no longer required and the side length of 25.0 Å above is used. We similarly put the C atom at the (0, 0, 0), the N atom and the H atom are at (1/L, 0, 0) and (-1/L, 0, 0) as shown in Figure 7 (L is the side length of the unit cell and is fixed at 25.0 Å here).

Figure 7. HCN in a large box (HCN is located at the vertex of the cubic unit cell)


Energy cutoffs ranging from 400.00 to 600.00 eV are tested for HCN. The results are summarized below in Table 4 and Figure 8. Based on these results, we chose the energy cutoff of 500.00 eV using the same tolerance for further calculations of HCN.

Table 4. Convergence tests on energy cutoff for HCN

Figure 8. Energy vs energy cutoff for HCN


Again as we did for the H2O molecule, we vary the N-C and H-C bond lengths while keeping all of them on the y-axis. The C atom remains (0, 0, 0) and the N and H atoms are located at (a/L, 0, 0) and (-a/L, 0, 0). Here, L=25.0 Å and a is chosen from 0.7 to 1.5 Å with the interval of 0.1 Å. The results are summarized below in Table 5.

Table 5. Results for H2O with different initial bond lengths


From these results, we can see that the energies for the cases with initial bond lengths of 0.7, 0.9, and 1.0 Å are significantly higher due to the large distances between atoms as shown in Figure 9. These atoms are pushed apart from each other with the similar reason for those H2O with very short bond lengths (only one H-C bond, the N atom is far away). For the case of 0.8 Å, it even cannot converge. The optimized structures for the rest cases are totally the same as shown in Figure 10. The N-C and H-C bond lengths are 1.161 and 1.075 Å, respectively. The bond angle qHCN is 180.00°.


Figure 9. Separated HCN with initially short distances    Figure 10. Optimized structure for HCN


Similarly, we then modify the initial structure by changing the bond angle to make sure that the force components are not canceled out by symmetry. So, with the C atom remaining at (0, 0, 0), the N and H are at (a/L, b/L, 0) and (-a/L, b/L, 0). L here is the side length of 25.0 Å, and according to the results above, the a is fixed at 1.2 Å while b is chosen from 0.1, 0.2, and 0.3 Å to have three different initial bond angles. After optimization, we find that all these three tests finally give the same free energy of -19.690 eV and the same optimized structure of HCN as shown in Figure 11. The N-C and H-C bond lengths are 1.161 and 1.075 Å, respectively. The bond angle qHCN is 179.95°. The energy is almost the same compared to the previous cases with bond angle of 180.00° and since three different bond angles finally converges to the same structure, this is the optimal structure for HCN. The experimental N-C and H-C bond lengths are 1.156 and 1.064 Å, and the bond angle 180.00°. We see that the DFT-predicted bond length and bond angle are very similar to the experimental results with differences less than 2%.

Figure 11. Optimal structure for HCN


4. Conclusion

To conclude, in this project, we find the optimal structures of H2O and HCN. For H2O, the DFT-predicted H-O bond length is 0.972 Å and the bond angle qHOH is 104.50° (the experimental values are 0.958 Å and 104.48). For HCN, the DFT-predicted N-C and H-C bond lengths are 1.161 and 1.075 Å while the bond angle qHCN is 179.95° (the experimental values are 1.156 and 1.064 Å, and 180.00°). We see that the DFT can accurately predict the bond lengths and bond angles for these selected molecules with differences less than 2% compared to experimental results.


Reference

  1. Kresse, G. and J. Hafner, Ab initio molecular dynamics for liquid metals. Physical Review B, 1993. 47(1): p. 558.
  2. Kresse, G. and J. Hafner, Ab initio molecular-dynamics simulation of the liquid-metal–amorphous-semiconductor transition in germanium. Physical Review B, 1994. 49(20): p. 14251.
  3. Kresse, G. and J. Furthmüller, Efficient iterative schemes for ab initio total-energy calculations using a plane-wave basis set. Physical review B, 1996. 54(16): p. 11169.
  4. Kresse, G. and D. Joubert, From ultrasoft pseudopotentials to the projector augmented-wave method. Physical Review B, 1999. 59(3): p. 1758.
  5. Blöchl, P.E., Projector augmented-wave method. Physical review B, 1994. 50(24): p. 17953.
  6. Perdew, J.P., K. Burke, and M. Ernzerhof, Generalized gradient approximation made simple. Physical review letters, 1996. 77(18): p. 3865.

Determination of the crystal structure with optimal lattice constant for Pt

  1. Description of the problem

For this first project, we aim to predict the most-favored crystal structure of Pt and calculate the optimal lattice parameters for these structures.

Usually, the metal crystals can have simple cubic (sc), face centered cubic (fcc), and hexagonal close packed (hcp) structures. In this work, we will firstly examine the optimal lattice parameter for sc Pt based on the energy of bulk Pt, followed by the tests of on the fcc structure. Both optimal lattice parameter a and the ratio a/c will be determined for hcp Pt. Convergence tests will be done with respect to the number of k-points and the cutoff energy for all studies.

The Vienna Ab initio Simulation Package (VASP) is used to perform the periodic DFT calculations,1-3 employing the projected augmented-wave (PAW) pseudopotentials,4,5 as well as generalized gradient approximation with the exchange-correlation functional by Perdew, Burke, and Ernzerhof (PBE).6

  1. Simple cubic

The sc structure of Pt is built using the software Material Studio as shown in Figure 1. In each unit cell, there is one Pt atom.

               Figure 1. Unit cell of sc Pt                       Table 1. Results of k-points convergence for sc

Before we can calculate the energy of this whole system, the convergence tests are required with respect to the number of k-points and the cutoff energy. The criteria for choosing the number of k-points and energy cutoff in the following calculation is set to have the energy difference within 0.01 eV.

Firstly, in order to test the convergence of the number of k-points, we initially set the cutoff energy to 400 eV. The results of using number of k-points ranging from 1 to 120 are summarized above in Table 1. Figure 2 shows the trend of bulk energy as well as the computational cost versus the number of k-points.

Figure 2. Bulk energy and computational cost versus the number of k-points for sc

We can see the bulk energy becomes more stable with increased number of k-points while the computational cost keeps increasing. Considering the balance between higher accuracy and cost, the k-points sampling of 14x14x14 is chosen for further calculations.

The convergence of the cutoff energy is also tested as summarized in Table 2 with fixed k-points sampling shown above. An interesting thing is that we can see the (pseudo) atomic energy keeps becoming lower while the cutoff energy is increased (later we will see the same behavior for all other structures). Figure 3 shows the relationship of bulk energy and computational costs depending on the cutoff energy.

Table 2. Results of the cutoff energy convergence for sc

Figure 3. Bulk energy and computational cost versus the cutoff energy for sc

Similar as the cases for k-points sampling, the energy becomes stable with increased cutoff energy while the cost keeps increasing. The energy cutoff of 400 eV is chosen for further calculations.

In order to determine the optimal lattice parameter, we vary the lattice parameter to find the one resulting in lowest bulk energy. We firstly do a rough search using step size of 0.1 Å from 1.50 to 3.00 Å. With such rough search, we are able to determine the interval where the optimal value lies in and based on that, we can do a more precious search with step size of 0.01 Å. All the results are shown in Figure 4.

(a)                                                                            (b)

Figure 4. Bulk energy versus the lattice parameter for sc. (a) for rough search and (b) for detailed search.

From the first plot in Figure 4, we can see that the optimal value is in the interval from 2.50 to 2.70 Å. The detailed search is done in this interval with step size of 0.01Å. Finally, the optimal lattice parameter is determined to be 2.62 Å, which gives the lowest bulk energy of -5.655 eV for the simple cubic structure.

  1. Face centered cubic

The search for the optimal lattice parameter of fcc Pt is very similar to the study of sc Pt. The unit cell of fcc Pt is built with Material Studio as shown in Figure 5, containing on Pt atom.

               Figure 5. Unit cell of fcc Pt                    Table 3. Results of k-points convergence for fcc

As we did before, the convergence tests are firstly made and the results on k-points are summarized in Table 2. Figure 6 shows the relationship of bulk energy as well computational time to the number of k-points. Similarly, the k-points sampling of 12x12x12 is finally used.

Figure 6. Bulk energy and computational cost versus the number of k-points for fcc

The same tests on cutoff energy is done as summarized in Table 4 and Figure 7. The cutoff energy we use for further calculations of fcc Pt remains 400 eV.

Table 4. Results of the cutoff energy convergence for fcc

Figure 7. Bulk energy and computational cost versus the cutoff energy for fcc

The search for the optimal lattice parameter is carried out in a similar way, but roughly ranging from 3.10 to 4.30 Å. The results are shown in Figure 8. We can see from the left side of Figure 8 that the optimal lattice parameter lies in the interval from 3.90 to 4.10 Å. Thus, the optimal lattice parameter is determined with the detailed search using step size of 0.01Å. The optimal lattice parameter is 3.97 Å, which gives the lowest bulk energy of -6.097 eV for the face centered cubic structure.

(a)                                                                            (b)

Figure 8. Bulk energy versus the lattice parameter for fcc. (a) for rough search and (b) for detailed search.

  1. Hexagonal close packed

The difference in determining the optimal lattice parameter for hcp Pt is that there will be different optimums for different c/a. So in this section, we will compare the opmital lattice parameter for several potential c/a ratios (in this section, cases of c/a=1.57, 1.60, 1.63, 1.67, 1.70, 1.73 will be studied) and find the most-favored one which gives us the lowest bulk energy among them. Similarly, the hcp unit cell is consturcted using Material Studio as shown in Figure 9 containing 2 Pt atoms.

Figure 9. Unit cell of hcp Pt

The case of c/a=1.60 is chosen to test the convergence. The results are summarized below in Table 5. Figure 10 and 11 show the trends of bulk energy as well as computational cost with respect to the number of k-points and cutoff energy, respectively.

Table 5. Results of the convergence tests for hcp

Figure 10. Bulk energy and computational cost versus the number of k-points for hcp

Figure 11. Bulk energy and computational cost versus the cutoff energy for hcp

Accordingly, the k-points sampling is chosen to be 10x10x6 and the cutoff energy is 400 eV.

The search for optimal lattice parameter is achieved using the same method, but with different c/a values roughly ranging from 2.00 to 3.30 Å. Figure 12 shows the results of rough search for different c/a values.

Figure 12. Bulk energy versus the lattice parameter for hcp (rough search)

We can see that, for the case of c/a=1.56, the optimum lies in the interval from 2.80 to 3.00 Å. For all other cases, the optimal parameter is in the interval from 2.70 to 2.90 Å. The results for corresponding detailed search is shown in Figure 13 below. The final results reveal that the optimal lattice parameter for hcp Pt is 2.76 Å with c/a=1.73, giving the lowest bulk energy of -6.046 eV.

Figure 13. Bulk energy versus the lattice parameter for hcp (detailed search)

  1. Conclusion

According to the results above, we know that the optimal lattice parameters for these three different structures are 2.62, 3.97, and 2.72 Å, respectively. Among them, the fcc structure with lattice parameter of 3.97 Å gives the lowest bulk energy of -6.097 eV (-5.655 and -6.046 eV for sc and hcp). The experimental lattice constant is 3.92 Å. Our result is about 1.01% larger than the experimental observation value, which is commonly seen while using PBE functional as PBE tends to overestimate the lattice constant.

Reference

  1. Kresse, G. and J. Hafner, Ab initio molecular dynamics for liquid metals. Physical Review B, 1993. 47(1): p. 558.
  2. Kresse, G. and J. Hafner, Ab initio molecular-dynamics simulation of the liquid-metal–amorphous-semiconductor transition in germanium. Physical Review B, 1994. 49(20): p. 14251.
  3. Kresse, G. and J. Furthmüller, Efficient iterative schemes for ab initio total-energy calculations using a plane-wave basis set. Physical review B, 1996. 54(16): p. 11169.
  4. Kresse, G. and D. Joubert, From ultrasoft pseudopotentials to the projector augmented-wave method. Physical Review B, 1999. 59(3): p. 1758.
  5. Blöchl, P.E., Projector augmented-wave method. Physical review B, 1994. 50(24): p. 17953.
  6. Perdew, J.P., K. Burke, and M. Ernzerhof, Generalized gradient approximation made simple. Physical review letters, 1996. 77(18): p. 3865.