Author: Andrew Wong
1. Introduction
Palladium is a transition metal that is vital in various technologies, such as in electronic components and fuel cells, and as an important catalytic material [1]. The goal of this post is to determine the preferred crystal structure of Palladium (Pd) based on the following three crystal structures: simple cubic (SC), face-centered cubic (FCC), and hexagonal closed packed (HCP). In order to determine the optimal crystal structure of Pd, plane wave basis Density Functional Theory (DFT) was implemented with the CAmbridge Series Total Energy Package (CASTEP) [2] in Materials Studios to calculate ground state energies of various crystal structures of Pd at different lattice constants. The lowest total energy of the three crystal structures are then compared to determine the optimal crystal structure of Pd and its respective lattice constant. From these calculations, the optimal lattice constants of the SC and FCC structure were determined to be 2.6 Åand 3.85 Å. Since the HCP crystal structure has two lattice parameters, the optimal lattice constant of HCP were a=2.9 Å and c= 5.04 Å from an optimal c/a value of 1.8. Comparing the energy per atom of each crystal structure, the FCC structure had the lowest structure while the SC and HCP structure were 0.217 and 0.514 eV/atom higher in energy than the FCC structure. As a result, the optimal crystal structure for Pd is the FCC structure with a lattice constant of 3.85 Å.
2. Methodology
2.1 Calculation Parameters
The DFT calculations performed in this post utilized the plane wave basis set with pseudo potentials method in CASTEP. The following calculation parameters used in the DFT analysis are shown below..
| Exchange-Correlation Functional Type | Generalized Gradient Approximation (GGA) | |||
| Exchange-Correlation Functional | Perdew-Burke-Ernzerhof (PBE) | |||
| K point Grid | Monkohrst-Pack [3] | |||
| Pseudopotential | OTFG Ultrasoft | |||
| Relativistic Treatment | Koelling-Harmon | |||
| SCF Tolerance | 2E-06 eV/atom | |||
| Core Radius | 1.6 a.u | |||
| Valence Electron Configuration | 4s2 4p6 4d10 |
2.2 Energy Cutoff Determination
Before the optimal lattice constant and K Points for each structure were determined, an energy cutoff optimization was performed to ensure the most accurate convergence of the energy calculations. The optimal energy cutoff value is then used for all three crystal structure to maintain consistency within the calculations. A FCC Pd crystal structure with an experimental lattice constant of 3.859 Å [4] and default K Point mesh grid of 7 x 7 x 7 was used to test for energy cutoff convergence. By varying the energy cutoff values from 100 to 600 eV, a plot of total lattice energy per atom and energy cutoff is shown below in figure 1.
Based on the results from figure 1, the energy cutoff for all DFT optimization calculations was chosen to be 500 eV since the energy per atom varied less than 0.01 eV at the cutoff energy. A higher energy cutoff value, such as 600 eV or more, could have been chosen as it retains but the computational effort to run these calculations would increase. As a result, a cutoff energy of 500 eV was deemed to be optimal for the lattice calculations.
2.3 K Point Optimization
A convergence test for K Points was implemented to further ensure the energy convergence of the three crystal structures. A K Points Optimization for each crystal structure must be implemented as the number of K Points directly dependent on the lattice constant value. Lattice constants for each structure were determined using the default 7 x 7 x 7 K Point Mesh Grid for the SC and FCC crystal structure and a 8 x 8 x 4 K Point Mesh Grid for the HCP crystal structure. The lattice constants that were determined from the default K Point mesh for the SC, FCC, and HCP structure were respectively 2.3 Å, 3.8 Å, a= 3Å and c= 5Å.
2.3.1 K Points Optimization for SC and FCC Structure
A convergence test for K Points was implemented to further ensure the energy convergence of both the SC and FCC crystal structures. This was conducted by plotting the total energy per atom of each structure with respect the number of irreducible K Points. Since the lattice constant, a, is constant on all three axis for the SC and FCC crystal structure, a Monkhorst-Pack Grid of M x M x M is utilized for K Points optimization. For both structures, an energy cutoff value of 500 eV was implemented. For the SC Structure, figure 2A was constructed below by varying the K Point Mesh size from 1x1x1 to 15x15x15 at the SC lattice constant of 2.3 Å.
As seen in figure 2A, the optimal number of K Points was determined to be 56 and a mesh grid size of 11 x 11 x 11. Higher number of K Points could have been implemented but the amount of computational effort would have increased significantly. As a result, the optimal number of K points for the simple cubic Pd structure was deemed to be 56. The energy at this number of K Points is -3492.550 eV.
Similarly, the optimal number of K Points needed for the Pd FCC crystal structure was shown below in figure 2B by varying the K Point mesh size from 1x1x1 to 10x10x10 at the optimal FCC lattice constant of 3.8 Å.
As seen in figure 2B, the optimal number of K Points was deemed to be 365 with a K Point mesh size of 9 x 9 x 9. The energy at this number of K Points is -3493.064 eV.
2.3.2 K Points Optimization for HCP Structure
Although the HCP K Point mesh grid is in the form of M x M x N, the same K Point convergence method used for the SC and FCC structure can be used for the HCP structure. By using a cutoff energy of 500 eV and lattice constant values of a = 3 Å and c = 5 Å, figure 2C was constructed below by plotting the total energy per atom with respect to the number of irreducible K points, varying the K Points mesh grid from 1x1x1 to 10x10x5.
From figure 2C, it was determined that the optimal number of K Points for the HCP Pd Crystal structure is 162 with a Mesh Grid of 9 x 9 x 4. The total energy per atom at this specific K Point value was -3492.847 eV.
3. Results and Discussion
3.1 Lattice Optimization of Simple Cubic and Face-Centered Cubic Pd
The optimal lattice constants for both the SC and FCC crystal structures were determined by calculating the total energy of the structure at various lattice constant values. Once this is completed, the optimal lattice constant corresponds to the structure with the lowest total energy. The SC lattice constants were varied from 2.2 to 3.4 Å and the FCC lattice constants were varied from 3 to 4.4 Å. Both the SC and FCC energies were then plotted against its respective lattice constant with a K Point mesh size of 11 x 11 x 11 and 9 x 9 x 9 respectively and an energy cutoff value of 500 eV. The lattice constant determination for the Pd SC structure is shown below in figure 3A.
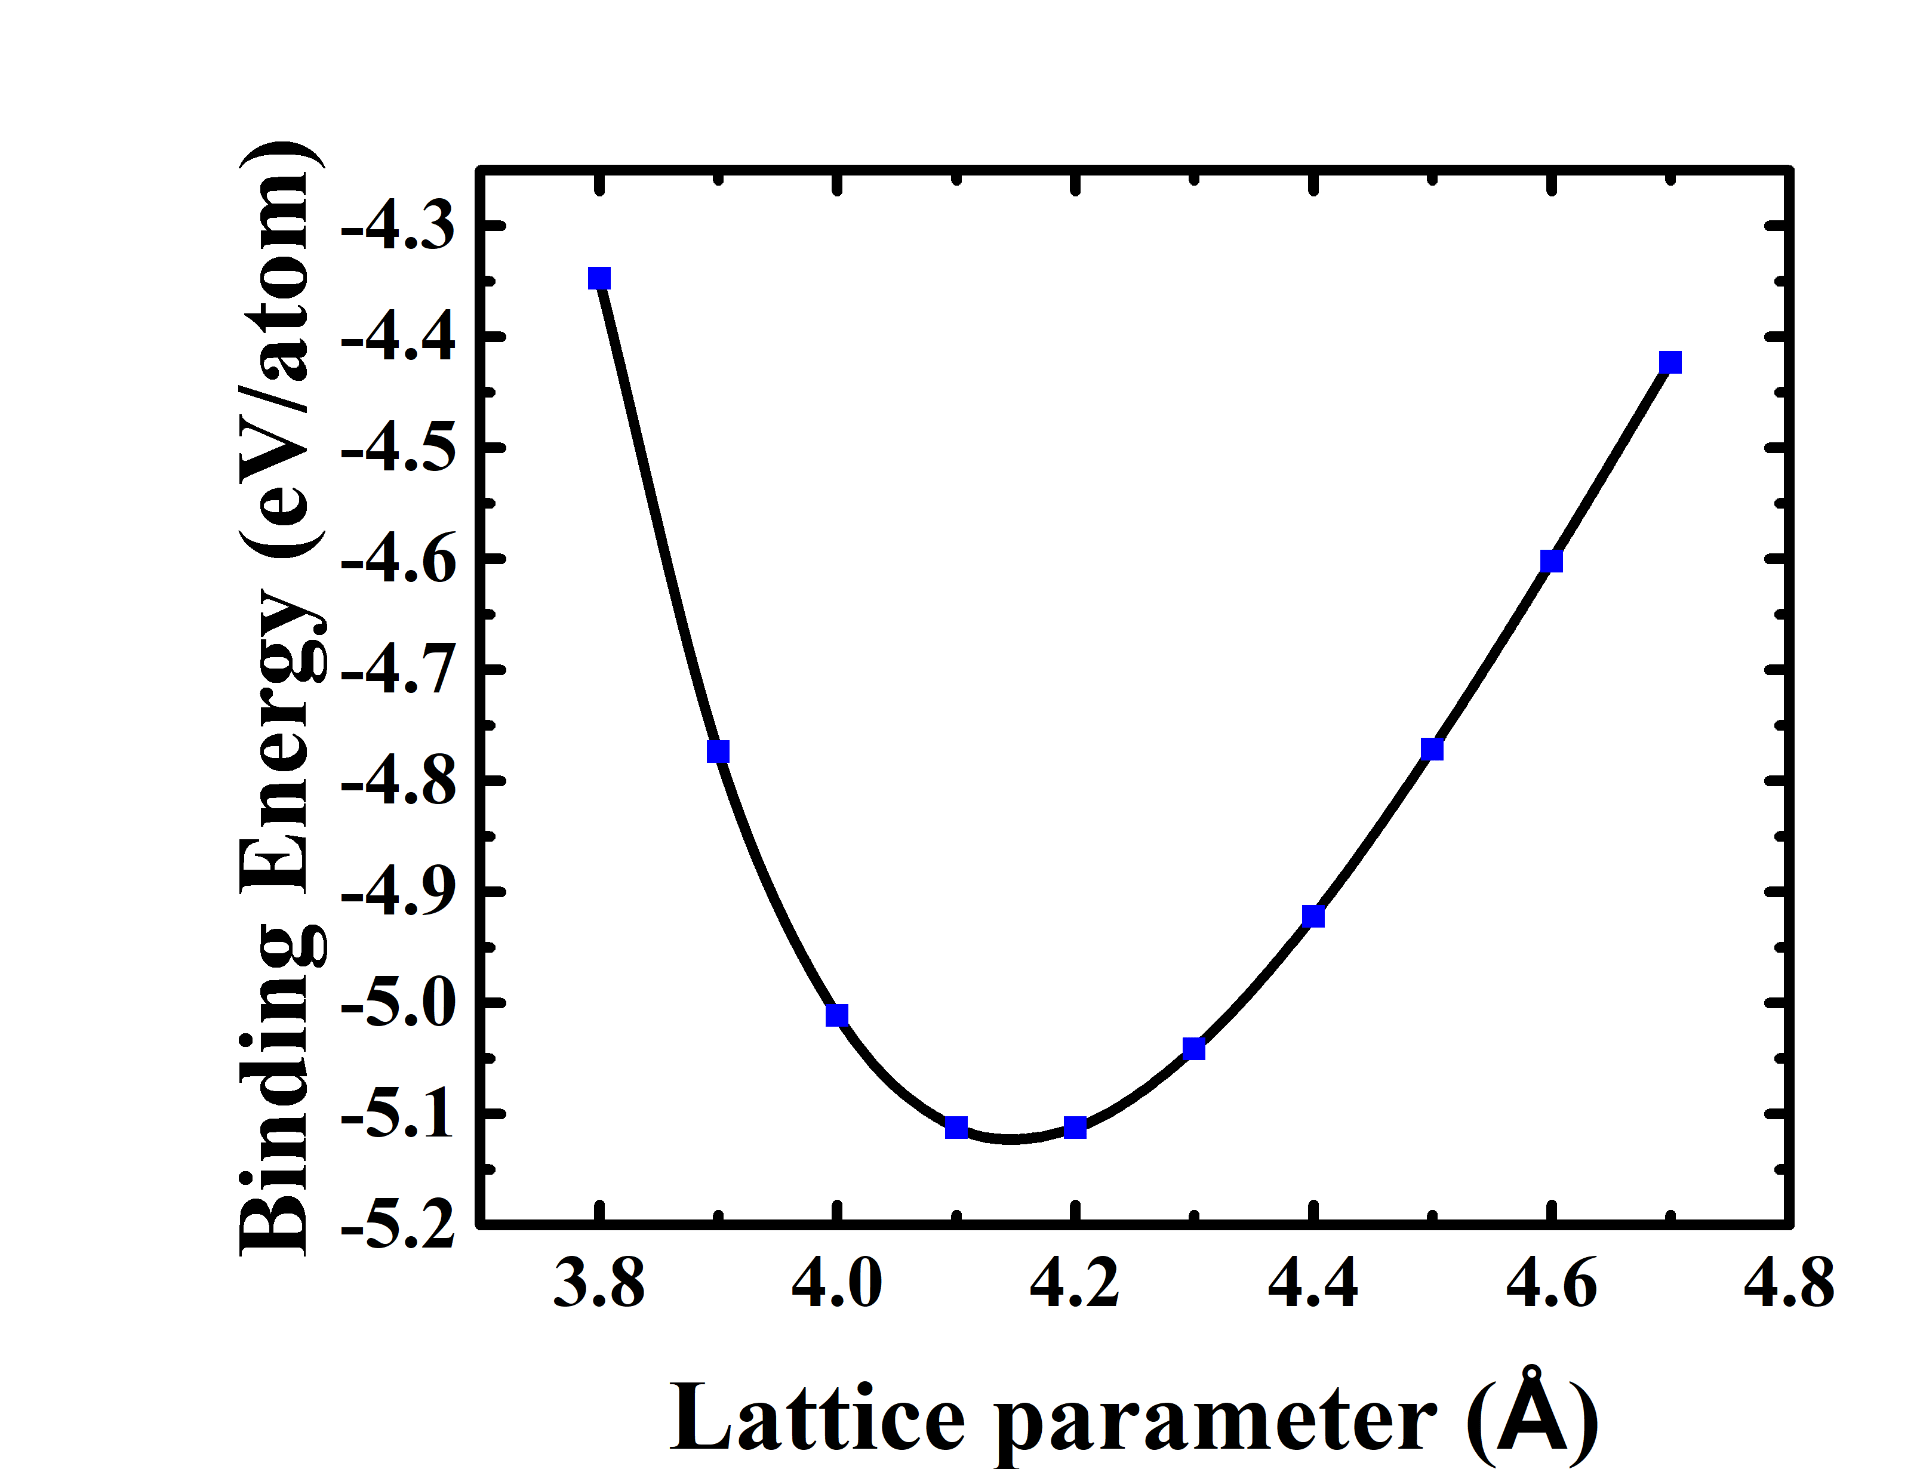
A polynomial fit was employed to determine the minimal energy of the Pd SC structure. As a result, the optimal lattice constant for the Pd SC structure was determined to be 2.6 Å at a total energy per atom value of -3492.711 eV. Following a similar process, the lattice constant was determined for the Pd FCC structure in figure 3B below.
By varying the lattice constant from 3 to 4.4 Å and employing a third order polynomial fit, the minimal structural energy was calculated at a value of -3493.131 eV, which resulted in an optimal FCC lattice constant of 3.85 Å.
3.2 Lattice Optimization of Hexagonal Closed-packed Pd
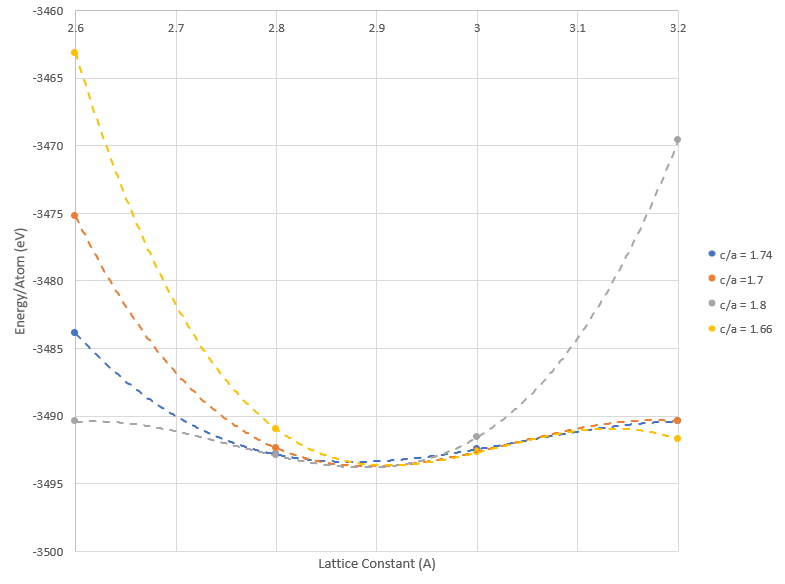
Unlike the SC and FCC structure, two lattice constants, a and c, must be determined for the HCP crystal structure. However, the DFT energy optimization used for the SC and FCC structure can still be implemented by fixing a lattice parameter ratio, c/a, and calculating the energy of the HCP structure at various lattice constant of a. Since there are two lattice constants values in the HCP structure, the K Point mesh grid is in the form of M x M x N. As a result, a K Point mesh grid size of 9 x 9 x 4 and a cutoff energy of 500 eV was implemented for the HCP DFT lattice optimization. By varying the c/a from 1.66 to 1.8 Å, Figure 3C was constructed below by plotting the total energy per atom with respect to the optimal lattice constants, varying the “a” lattice constant from 2.6 to 3.2 Å.
Before the optimal lattice constant can be determined, polynomial fits for each c/a ratio was implemented to determine which lattice parameter ratio had the lowest energy minimum. As a result, the lowest energy minimum occurred at a c/a ratio of 1.8 at an energy of -3492.935 eV. Furthermore, the optimal HCP lattice constants for Pd was determined to be a = 2.9 Å and c = 5.04 Å.
4. Conclusion
The table below shows a summary of the optimal lattice constant, energy cutoff, and K Points calculated for each of the three crystal structures at its minimized total energy.
| Crystal Structure Type | Lattice Constant (Å) | Energy/Atom (eV) | Energy Cutoff (eV | Number of Irreduciable K Points | K Point Mesh Grid Size |
|---|---|---|---|---|---|
| Simple Cubic | 2.6 | -3492.550 | 500 | 56 | 11 x 11 x 11 |
| Face-Centered Cubic | 3.85 | -3493.064 | 500 | 365 | 9 x 9 x 9 |
| Hexagonal Closed-Packed | a = 2.9 c = 5.04 | -3492.847 | 500 | 162 | 9 x 9 x 4 |
From the data above, it is concluded that the preferred structure for Pd is FCC with a lattice constant of 3.85 Å since this is the structure with the lowest total energy per atom. To confirm the validity of our result, the lattice constant and structure of Pd was then compared to an experimental paper as reference which is shown below.
| Source | Preferred Structure of Pd | Optimal Lattice Constant (A) |
|---|---|---|
| DFT | FCC | 3.85 |
| Experimental [4] | FCC | 3.859 |
As seen from the table above, the DFT calculations are in agreement with the experimental source in terms of the lattice constant and the preferred crystal structure. Differences between the lattice constants are expected as the DFT calculations assume the model contains perfect shapes of each Pd crystals and is run in vacuum. In conclusions, the following DFT energy optimization technique implemented in this post confirms the preferred crystal structure of Pd to be Face-centered cubic with a lattice constant of 3.85 Å.
5. Citations
[1] “Palladium.” Wikipedia, Wikimedia Foundation, 3 Feb. 2020, en.wikipedia.org/wiki/Palladium.
[2] Clark Stewart J et al., “First principles methods using CASTEP ,” Zeitschrift für Kristallographie – Crystalline Materials , vol. 220. p. 567, 2005.
[3] H. J. Monkhorst and J. D. Pack, “Special points for Brillouin-zone integrations,” Phys. Rev. B, vol. 13, no. 12, pp. 5188–5192, Jun. 1976.]
[4] Davey, Wheeler P. “Precision Measurements of the Lattice Constants of Twelve Common Metals.” Physical Review Journals Archive, American Physical Society, 1 June 1925,


