
Ah, the unemployment rate. An economist’s favorite statistic! Right? While the unemployment rate may seem like a simple statistic you occasionally see on your nightly news, that statistic is just one of many unemployment rates. Because of this, the “true” unemployment, or the unemployment rate that should be considered official has been a hotly contested subject over the past decade and especially in this past election. This debate however, has been hushed away from the public eye and was probably over shadowed by the flashier and sexier controversies of late. According to the Bureau of Labor Statistics, the current unemployment rate stands at 4.7% as of the end of February, yet on the campaign trail and in office, President Donald Trump has suggested that the current statistic may be underestimating true unemployment in America. In fact, he has claimed that the true unemployment rate may be upwards of 42%. Why is there such a drastic difference in the two rates? Does Trump’s claim have any real backing? What should the real unemployment rate be?
First, let’s talk about how the unemployment rate is calculated. Without getting too tech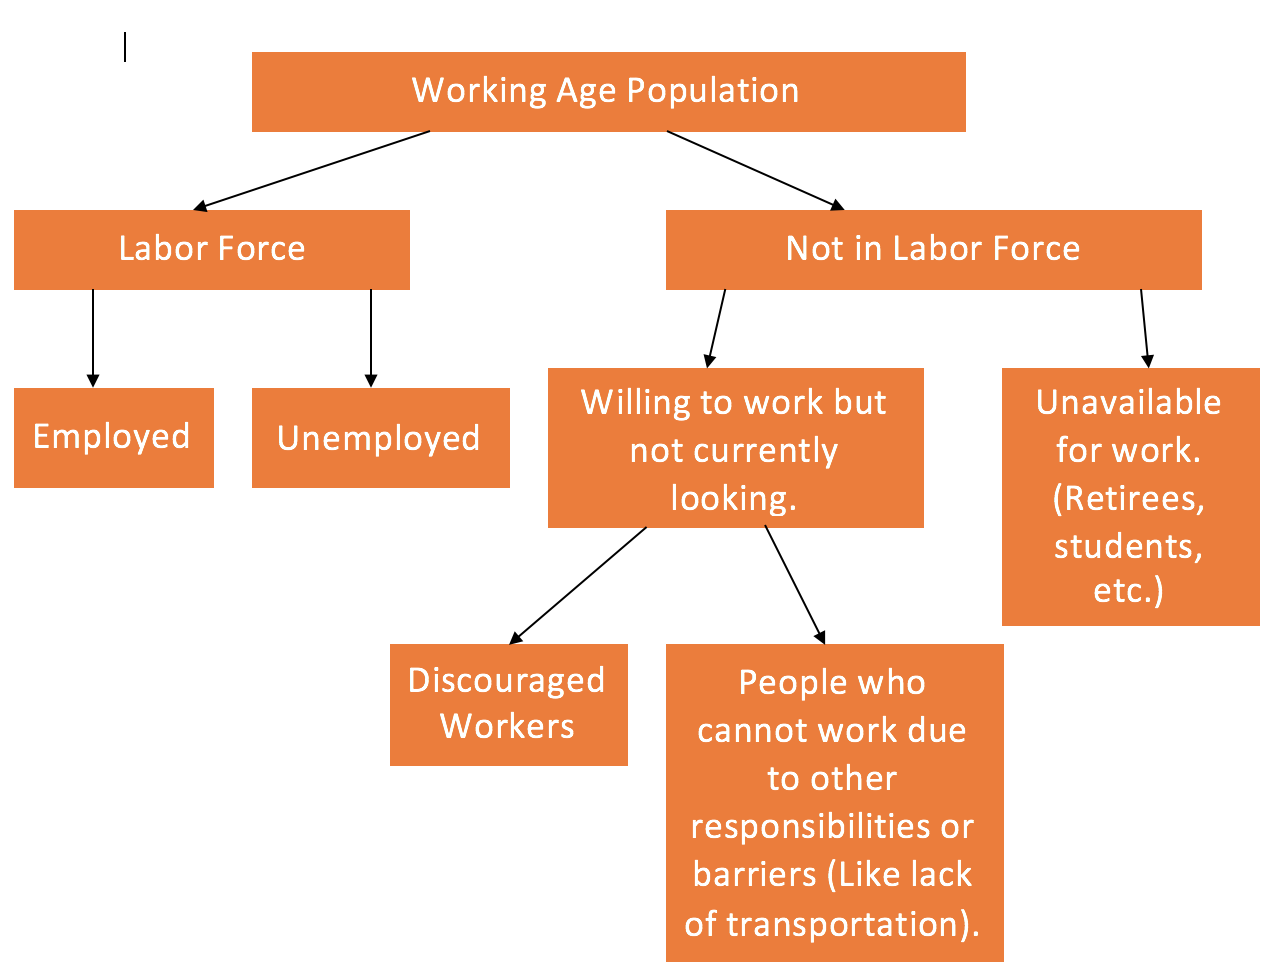 nical, the unemployment is simply the number of people who are unemployed and have looked for work in the past 4 weeks divided by the total labor force. The labor force consists all Americans
who are readily available for work. Because of this, we do not include stay-at-home mothers, retirees, full time students, or disabled citizens in that labor force number. There are two other definitions that are important to understand: ‘working age population’ and ‘discouraged workers’. The working age population is simply all Americans above the age of 16. Discouraged workers are those who aren’t working and have given up on looking for work because they do not believe there are jobs available for them. Discouraged workers are considered to be out of the labor force and are therefore, not included in the unemployment rate even though they are willing to work.
So how did Trump get his 42%? Well, he took all the Americans above the age of 16 who weren’t in the labor force, added them to the rest of the unemployed and divided it all by the people in the working age population. This means, that stay-at-home moms, discouraged workers, your retired grandpa, and even you, a full time-student, are counted as unemployed under Trump’s claim. Essentially, Trump’s estimates include people who are unemployed because they choose to be so, which is a normal aspect of a market economy. Why is this an issue? People respond to economic indicators like inflation rates, GDP growth, and unemployment. We see these statistics all the time in our nightly news. Furthermore, how American’s perceive the economy to be fairing effects their spending habits. Additionally, by manipulating the statics, Trump is able to make people believe that the current economic situation fostered under the Obama administration is worse than it really is. Playing to American citizen’s lack of an understanding about what the unemployment really means paints an unfair picture of the last president. Therefore, it is important these data be shown accurately and fairly and that those watching understand what the data means.
There are also various different unemployment rates that fall in-between the BLS’ 4.7% and Trump’s preposterous and misleading 42% claim. To understand these variances, let’s look at what it means to be employed. People who work part-time and people who are underemployed are also included to be employed. (Underemployed means a person is forced to settle for a job they are over qualified for. Like a PhD working in McDonalds.) When you add all those who want to work but have not looked for a job in the past few weeks, the unemployment rates rise by 1% to 5.7%. While yes that may seem small, but that’s still about a million American lives who cannot make ends meet. Furthermore, if you tack on all of those who are working part-time because they cannot find full-time positions, the rate jumps up to 9.2%.
While working part-time can fall under the umbrella of underemployment, there are other factors like a mismatch of human capital to a job (i.e: A PhD at McDonalds). It measures what percentage of people in the labor force are not being used to their most efficient/maximum capabilities. These types of underemployment are important too because they can show how well the labor market is performing in highly skilled and specialized industries. The current estimated underemployment rate is 13.7%.
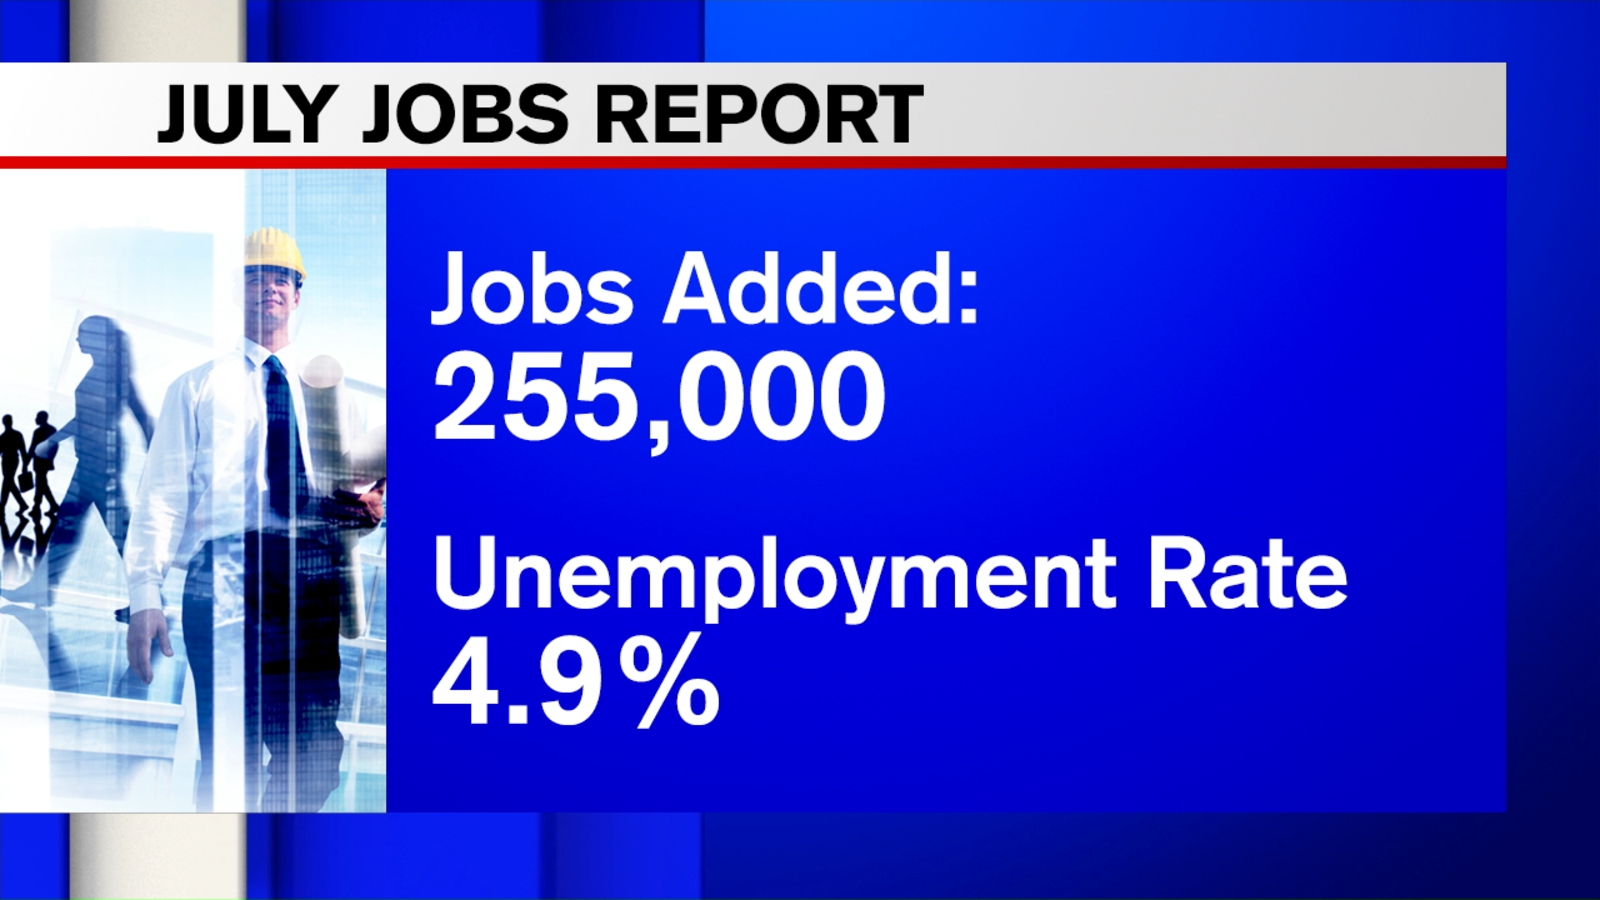
This ABC news show only shows the basic unemployment rate.
4.7%, 5.7%, 9.2%, 13.7%, and 42% all tell different stories. It is important to understand the dangers of a populous who is uninformed: potential for manipulation. In a time when alternate facts can take precedent over their widely accepted counterparts and when most media have at least some bias, and therefore, political agenda, that the everyday American can distinguish and dissect these statistics so they can make their own decisions about the state of the economy and consequently, the successfulness of the government in maintaining it. Because of this, Unlike an avid follower of the economy like myself, I doubt the typical American will take the time to research these different rates. I believe the news must do a better job of bringing statistics like the other measurements of unemployment and underemployment (Not including Trumps bogus claim though.) into the national spotlight.
Sources:
https://www.bls.gov/news.release/empsit.t15.htm
http://www.investopedia.com/terms/u/underemployment.asp