Most algorithms to identify the Pareto frontier don’t care about the actual values of the points, they only care about the order statistics. Are all of the attributes of one point at least as good as the attributes of another point, and is at least one better? If so, the first point dominates the second. Otherwise not.
So an interesting transformation of the data is to take each column of attributes, and replace their absolute values with a number that indicates their relative position in the ordering. So if we have three points that each have as attributes for max speed as {455, 22, 3090}, we replace those values with {2, 1, 3}. This retains their relative ordering. After doing this for each attribute, you end up with what I call Lattice Latin Hypercube form, or LLH for short. The Mathematica code to generate it is simple:
makeLLH[data_] := Transpose[Map[Ordering[Ordering[#]] &, Transpose[data]]];
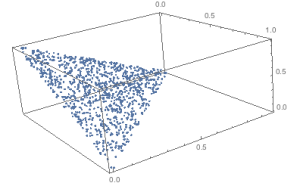
Here are some examples of original data and transformed data.
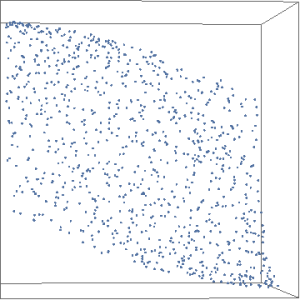
Simplex data
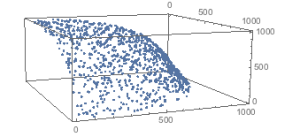
Transformed
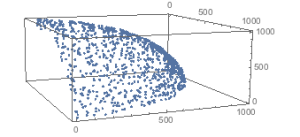
Notice how what was originally planar data is now convex. This was a surprise when I first saw it. Next example is spherical data.
Transformed.
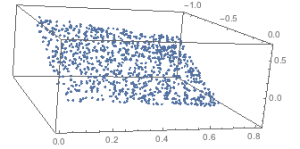
Looks very similar. Next up is a rotated rectangular plane
Here’s a rotating GIF so you can see it is transformed from planar to…something otherwise. Click on the image to see it rotate, unable to do so in the post.
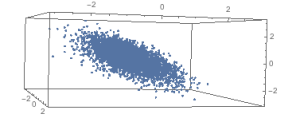
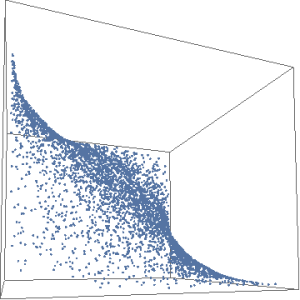
Here’s 4000 pts distributed multi-variate normal on a plane, and the transformed version. Significant difference!
Click on the plot to see a rotation.
