The Impact of Gentrification in Washington DC
Washington DC serves as our nation’s capital and a setting of great cultural and political importance. But despite its outsized role on the cable news networks, its 650,000 residents are frequently overlooked or ignored – not least by the founders of our government, who denied Washingtonians any voting representation in Congress.
DC is not a titan in terms of population: it barely makes the list of the largest 25 cities in the United States. Still, its demographic profile is noteworthy and the change it has undergone over the past generation merits study. The following paper analyzes demographic trends in Washington DC with particular focus on the process and impact of gentrification. It finds that DC’s population has changed in its age and racial composition, with most new residents being younger and white. Furthermore, it finds that residents in mostly white neighborhoods tend to own more valuable houses and have higher levels of educational attainment. It concludes with a discussion of steps that can be taken to acknowledge and begin to address the effects of gentrification in the city.
Demographic Profile of Washington DC
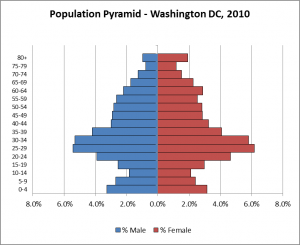
Washington DC is a city of over half a million people: 601,723 in the 2010 census, and estimated at 647,484 by the American Community Survey in 2015. It has an interesting population structure, shown in Figure 1 below. Thanks to a robust labor market in the government, politics, consulting, and law sectors that attracts people of young working age (20-40), DC has a dearth of children, particularly of elementary school age, and a wealth of young professionals. Meanwhile, there are relatively few older working age individuals or retirees: as individuals have families and become more senior in the workplace, many choose to move out of the city to the suburbs or leave the government / government sector (and the DC area) entirely.
Figure 1: Washington DC Population Structure
One result of this trend is that DC has an extremely low dependency ratio, both in terms of aged dependency and child dependency. As shown below, each of those figures is – by a wide margin – lower than any state in America (Howden and Meyer, 2011).
Table 2: Dependency by State

The sex ratio of the DC population is about 90, meaning that there are roughly 90 male residents per 100 females. As in most areas, there are more males than females at younger ages (0-9), but more females than males among seniors (65+).
As of the 2010 census, just over half of DC’s residents identify as black, 38.5 percent identify as white, and roughly 10 percent identify as Asian or other races. The Hispanic/Latino population is about 11 percent, though will not be considered a distinct race category for the purpose of this analysis.
Gentrification
Gentrification is not a concept that has a strict academic definition. However, it is generally understood to involve “the movement of people with relatively higher socioeconomic status into distressed neighborhoods and the displacement—either through increases in housing prices or other means—of existing lower-class residents. In most, but not all, examples of gentrification in U.S. cities, the new residents are middle- or upper-class whites while those being displaced are lower income African Americans” (Sturtevant 2016). Prince describes gentrification from the African American perspective: “Gentrification means ‘not belonging’ in areas of the city that were once commonly known or frequently traversed. It is visiting elderly kin in neighborhoods that have become unfamiliar, witnessing the declining use of informal but cherished place-names for parks and communities in public discourse and the mass media, doing a double take while walking by the tanning salon that has popped up in your neighborhood or the drawing of racial battle-lines at the local, listener-sponsored, progressive radio station” (Prince 11).
In Washington DC, this process manifests itself in predictable ways: as new, higher-income, younger, and disproportionately white residents move into the city, many longtime (and disproportionately African American) residents have been pushed out. Gentrification has been occurring in the District for decades. Lloyd identifies the process as far back as the 1970s, when a crescent of neighborhoods surrounding downtown DC quickly experienced significant residential displacement and racial change whereby “single whites and white couples replaced black families” (Lloyd, 2015). In DC’s Shaw neighborhood (where I live), the population dropped from 78 percent black in 1980 to 44 percent in 2010 and surely lower today. Meanwhile, housing prices in Shaw jumped dramatically: the median price from $147,000 in 1995 to $781,000 today. Even adjusted for inflation, the average family income of Shaw residents nearly tripled from 1979 to 2010 (Gringlas, 2017).
DC’s status as a “federal city, a locus for rapid demographic change, and a major tourist destination” and its location bordering “the American north and south” and being both “at once a provincial small town and the anchor of a global metropolitan area” have contributed to its swift demographic transition (Prince 11). The demographic data shows this transition very clearly.
DC’s population rose from 1900 to 1950, hitting an apex of 800,000 residents. It fell gradually to below 600,000 in 2000, then rebounded to above 600,000 in 2010 – and has risen further since then (Sturvetant, 2016).
Figure 3: Washington DC Population by Census Year, 1900-2010

The age structure of DC’s population has changed somewhat in recent decades, as shown in Figure 4. Since 2010, the population additions have come disproportionately from young children (0-4) and young working age adults (20-40), as well as some seniors (50-65).
Figure 4: Washington DC Population Structure, 2000-2010

Furthermore, the rebounding population since 2010 (+30,000) has come principally from new white residents (+50,000), while the number of African American residents dropped by nearly 40,000. A chart from CensusViewer.com helps identify exactly who the new white residents are: principally younger white individuals, ages 20-35 (CensusViewer, 2017).
Figure 5: Washington DC Population Change 2000-2010, by Race
| Net Change, 2000-2010 |
Total |
White |
Black |
Asian |
Other |
Hispanic |
| +29,664 |
+50,286 |
-39,035 |
+5,779 |
+2,838 |
+9,796 |
Figure 6: Washington DC Population Change 2000-2010, by Age/Race

Regionally, the DC Office of Planning notes that between 2000 and 2015, the population swelled particularly in a number of predominantly white neighborhoods: (a) Mount Vernon Triangle, (b) Capital Riverfront, (c) U Street, (d) Columbia Heights, (e) NoMa, (f) Logan Circle, and (g) Foggy Bottom (Office of Planning, 2016).
Figure 7: DC Population Growth 2000-2015

Inequalities
A closer study of these changes yields troubling conclusions: there are great inequalities, driven by race, across the different regions of DC. In particular, predominantly black neighborhoods tend to have lower levels of educational attainment and lower median property values.
One methodological note: this report uses zip code level data to compare regions within DC, as such data was most easily accessible and manageable. It also relies on relatively straightforward comparisons and correlations. More detailed data (i.e. at the census tract level) would be preferable for a more granular analysis, and more complex statistical techniques (i.e. regression analysis) would eliminate many sources of error and spurious variables. A full map of DC’s zip codes is shown in Appendix 1.
At the zip code level, I grouped DC’s inhabited (500+ population) zip codes into three categories: mostly white (12 zip codes making up 32 percent of the population), mixed race (5 zip codes and 31 percent of the population), and mostly black (7 zip codes and 37 percent of the population).
There are differences in indicators between the groups. Zillow data on median home values by zip code reveals that houses in mostly white zip codes are over $200,000 more valuable than those in mostly black zip codes. In terms of educational attainment, an average of 80 percent of residents in mostly white zip codes have graduated college, compared to an average of 32 percent in mostly black zip codes.
Figure 8: Zip Code Groupings
| Category |
Definition |
Population (2015) |
Proportion of City (2015) |
Median Home Value |
Non-Coll Grad |
Coll
Grad |
| Mostly White |
65+% White |
201,966 |
32% |
$675,022 |
20% |
80% |
| Mixed |
30-65% White |
193,964 |
31% |
$588,850 |
39% |
61% |
| Mostly Black |
<30% White |
228,296 |
37% |
$441,871 |
68% |
32% |
Simple correlations demonstrate the same point: race is a variable that is closely linked to educational attainment and home prices in DC. Without controlling for any other variables, the race of a particular zip code explains 80 percent of its educational attainment (Washington DC Zip Codes, 2017).
Figure 9: Educational Attainment by Race

And race explains nearly 40 percent of the median home value in a given zip code (Zillow, 2017).
Figure 10: Home Values by Race

There are many other metrics that would demonstrate the inequalities between different parts of DC: housing values and educational attainment are but two examples. These differences have been magnified as DC’s racial composition has changed, and it will take a concerted, major effort to reverse these trends.
Policy Implications and Discussion
Prince writes that one of the first steps in addressing the negative consequences of gentrification is simply getting all parties to acknowledge the existence of the process itself. She says that many whites have “a tendency to minimize the impact of structural inequality in shaping their place in a changing DC. In this scenario, urban development is viewed as an outgroup of hard work and ingenuity. Conversely, those African Americans who did not purchase or renovate their parents’ homes or prevent crime from sucking the worth out of properties and the enjoyment out of city life, have failed to succeed in the game of modern, urban economic achievement” (Prince 32). So, publicizing conclusions of studies like this one are an important first step to reducing inequalities: gentrifying individuals need to recognize the consequences of the city’s demographic change.
Secondly, offsetting the negative impact of gentrification requires active efforts by policymakers and private businesses to devote resources toward underserved areas. Thankfully, there are signs that this is occurring. For example, Washington DC’s successful bikesharing network (Capital Bikeshare) was criticized early in its existence for locating its ‘docks’ mostly in well-to-do, gentrified neighborhoods. In recent years, it has made efforts specifically to expand into lower-income, traditionally African American neighborhoods like Anacostia. Said a recent press release, “the [eight] new locations will add to the 24 stations already serving communities east of the Anacostia River and connect with parks, recreation centers, schools, retail establishments, and public transit facilities across these communities” (Bikeshare, 2017). And DC’s new Mayor has pledged to increase city resources in minority communities. In October of last year, she broke ground on a new retail and dining location in Anacostia, saying “this project is another sign of my Administration’s commitment to invest in supportive services and jobs in neighborhoods across all 8 wards” (Executive Office, 2016).
Thirdly, specific local laws giving longtime homeowners more of an ability to remain in their homes can prevent developers from buying homes and bulldozing them. Lloyd (2015) finds evidence that allowing families the ‘right of first refusal’ in selling their property – can be effective in slowing gentrification, though will not stop it entirely. These laws can be hit-or-miss; the Washington Post reports that a city policy designed to reduce gentrification, titled Tenant Opportunity to Purchased Act (TOPA), was designed to protect tenants from displacement but in actuality has not served residents’ best interests (Hauslohner, 2016). But local funding directed toward community preservation can help. According to NPR, federal block grants allocated to cities for community development work can fund affordable housing, improved infrastructure, and community projects. Since gentrified neighborhoods expand the tax base, they should draw higher levels of funding, and that funding should be put toward community preservation (Gringlas, 2017).
The city’s housing market is booming, and “even neighborhoods with the highest concentrations of poverty and crime – places once thought immune to the influx of newcomers – are being eyed by developers” (Gringlas, 2017). Gentrification can bring positive developments: in Shaw, “at least some of the improved resources and services such as lighting, a new library, and a renovated recreation center are welcome changes” (Gringlas, 2017). But city officials will need to continue to push to build affordable housing units, preserve existing low-income housing, and implement policies that benefit long-term tenants in order to slow the appetite for market-rate apartments in ‘trendy’ sections of the city and allow long-term residents to remain in their homes.
References
Capital Bikeshare. (2017). “East of the Anacostia River Network Expansion.” Retrieved from: https://www.capitalbikeshare.com/blog/east-of-the-anacostia-river-network-expansion
District of Columbia Office of Planning (2016). Population Trends. 2016, April 26. Retrieved from: https://dme.dc.gov/sites/default/files/dc/sites/dme/publication/attachments/Office%20of%20Plann ing%20Presentation%20for%20CSCTF%204%2026%2016.pdf
Executive Office of the Mayor. (2016, Oct 6). “Mayor Bowser Breaks Ground on New Anacostia Development.” Retrieved from: https://mayor.dc.gov/release/mayor-bowser-breaks-ground-new- anacostia-development
Gringlas, Sam (2017, Jan 16). Old Confronts New In A Gentrifying D.C. Neighborhood. NPR. Retrieved from: https://www.npr.org/2017/01/16/505606317/d-c-s-gentrifying-neighborhoods-a-careful- mix-of-newcomers-and-old-timers
Hauslohner, Abigail (2016, Feb 6). Why a law meant to protect the poor from gentrification doesn’t really work. The Washington Post. Retrieved from: https://www.washingtonpost.com/local/dc- politics/why-a-law-meant-to-protect-the-poor-from-gentrification-doesnt-really- work/2016/02/06/2a26f818-cc40-11e5-88ff-e2d1b4289c2f_story.html?utm_term=.52df1626195e
Howden, Lindsay, and Meyer, Julie (2011, May). Age and Sex Composition: 2010: 2010 Census Briefs. United States Census Bureau. Figure 8: Age Dependency Ratios by State: 2010. Retrieved from: https://www.census.gov/prod/cen2010/briefs/c2010br-03.pdf
Lloyd, James M. (2015). Fighting Redlining and Gentrification in Washington, D.C.: The Adams-Morgan Organization and Tenant Right to Purchase. Journal of Urban History, Vol. 23 (6) 1091-1109. Retrieved from: http://journals.sagepub.com.ezaccess.libraries.psu.edu/doi/10.1177/0096144214566975
Prince, Sabiyha. African Americans and Gentrification in Washington, D.C.: Race, Class, and Social Justice in the Nation’s Capital. Ashgate: 2014. Retrieved from: https://books.google.com/books/about/African_Americans_and_Gentrification_in.html?id=XWlz BAAAQBAJ&printsec=frontcover&source=kp_read_button#v=onepage&q&f=false
Sturtevant, Lisa (2014). The New District of Columbia: What Population Growth and Demographic Change Mean for the City. Journal of Urban Affairs Vol. 36 , Iss. 2, 2014. Retrieved from: https://doi-org.ezaccess.libraries.psu.edu/10.1111/juaf.12035
Tatian, P. and Lei, S. (2015, May 2). Our Changing City [Blog post]. The Urban Institute. Retrieved from http://apps.urban.org/features/OurChangingCity/demographics/#index
U.S. Census Bureau (2016). Race American Community Survey 1-year estimates. Retrieved from: https://censusreporter.org/data/table/?table=B02001&geo_ids=16000US1150000&primary_geo_i d=16000US1150000
Washington, District of Columbia Population: Census 2010 and 2000 Interactive Map, Demographic Statistics, Quick Facts. CensusViewer. Retrived from: http://censusviewer.com/city/DC/Washington
Washington, DC Zip Codes (2017). United States Zip Codes Dot Org. Retrieved from: https://www.unitedstateszipcodes.org/dc/
Washington DC Office of the Chief Technology Officer (2017). Open Data DC: Census Tracts by Population Change – 2000. Retrieved from: http://opendata.dc.gov/datasets/census-tracts-by- population-change-2000
ZHVI All Homes (SFR, Condo/Co-op) Time Series (2017). Zillow Data. Data File. Retrieved from: https://www.zillow.com/research/data/
Appendix 1: Washington DC Zip Code Map


