
by Wilson Yanez
One of the most fundamental ways to differentiate a material from being a metal or an insulator is by computing the energy states of its electrons near the Fermi level. If there is a continuous number of states the material will show a metallic behavior and if there is an energy range in which there are no states available near the Fermi energy (band gap) it will be an insulator [1]. For this reason, correctly determining the number of states at a given energy (density of states) or the energy of these states at a given momentum (band structure) plays one of the most important roles in studying solids and a great amount of physical information (such as electrical conductivity or optical response) can be extracted from them.
In this post we compute the density of states and band structure of Ag and Ag2O as a mean to explore the capabilities of DFT to differentiate between a metal and an insulator through the appearance of a gap near the Fermi energy in the band structure.
Our approach was to fist define the respective unit cell and Brillouin zone of Ag and Ag2O as can be seen in figure 1 and 2. Then we compute its density of sates (DOS) with a different k point mesh. Once we have a well converged calculation (no change in the DOS) we compute the band structure which has a higher computational demand.

Figure 1: Unit cell (left) and Brillouin zone (right) of Ag.

Figure 2: Unit cell (left) and Brillouin zone (right) of Ag2O.
Calculation Parameters
We use a plane wave basis set from CASTEP, a generalized gradient approximation (GGA) Perdew, Burke and Ernzerhof (PBE) functional and an on the fly generated (OTFG) pseudopotential [2,3]. The core radius is RC=2.40 Bohr (1.27 Å) and the electronic configuration is 4s2 4p6 4d10 5s1. The energy cutoff is 500 eV and the smearing scheme is Gaussian with a width of 100 meV.
Calculation
We first obtain the DOS of both Ag (figure 3) and Ag2O (figure 4) with different k point meshes and study its convergence. We noticed that using an 8x8x8 mesh, the difference in the DOS is less than 0.8 electron/eV and that it shows the general shape of the DOS reported in the literature [4]. As can be seen in figure 3 and 4, the number of k points has a significant impact in the results of our calculation. We can also see that our calculations show a non zero density of states near the Fermi energy for both Ag and Ag2O which is characteristic of a metal and opposes the measured insulating behavior of Ag2O.

Figure 3: DOS of Ag computed with a single k point (a) and with a 8x8x8 k point mesh (b)

Figure 4: DOS of Ag2O computed with a single k point (a) and with a 8x8x8 k point mesh (b)
After finding the DOS, we compute the band structure of Ag and Ag2O as can be seen in figures 5 and 6. Here again, we see that the band structure is non zero at the Fermi level, once again confirming the metallic behavior predicted by the density of states. It is important to acknowledge that the reported band gap in figure 6 of 6 meV is comparable to the uncertainty in our calculations. Thus it is not significant enough to be considered a real physical effect. This can also be seen in figure 7 where we show a close up image of the band structure near the Fermi energy of the material.
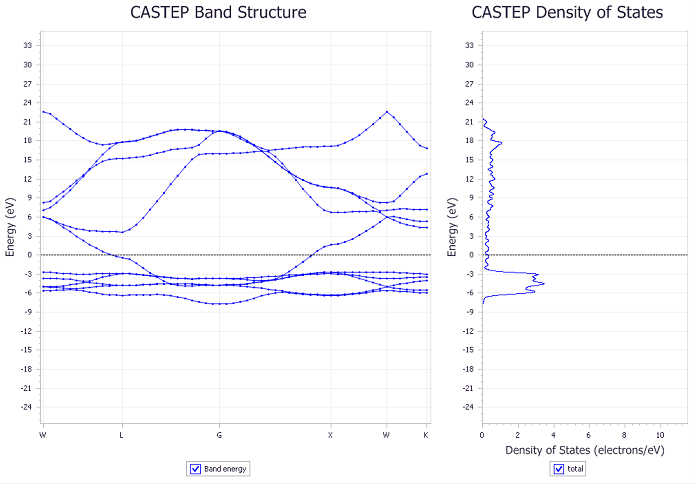
Figure 5: Band structure (left) and DOS (right) of Ag
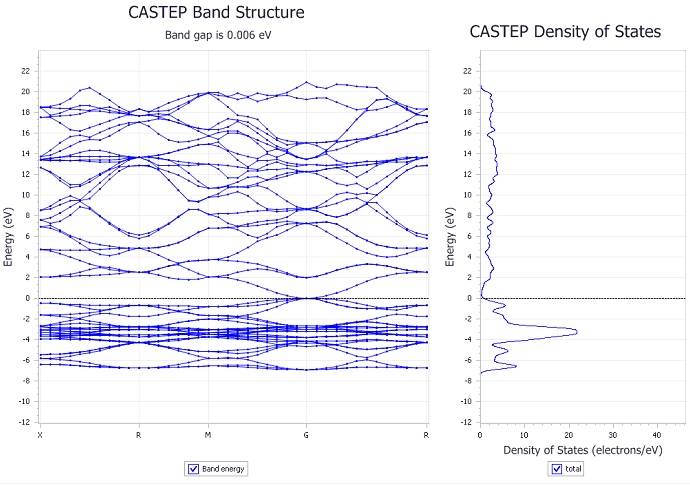
Figure 6: Band structure (left) and DOS (right) of Ag2O

Figure 7: Zoom in image of the band structure (left) and DOS (right) of Ag2O near the Fermi level
To have a more realistic realization of the actual physics in Ag2O we compute the DOS and band structure including spin orbit coupling. This is a second order relativistic correction to the energy of the solid that takes into account the effect of the angular momentum of its orbitals on the electronic spin degree of freedom. Thus giving a more realistic representation of its physical behavior. With this in mind, we see that a narrow band gap of 69 meV appears in the material. We also see small changes in the degeneracy of the band structure in comparison to the non spin orbit interaction case.

Figure 8: Band structure (left) and DOS (right) of Ag2O including spin orbit coupling

Figure 9: Zoom in image of the band structure (left) and DOS (right) of Ag2O near the Fermi level including spin orbit coupling.
It has been reported that the error in the determination of the band gap comes from the self interaction in the occupied bands which can be overcome by using hybrid functionals like HSE03 and HSE06 [5]. Nevertheless, with these functionals we were unsuccessful in archiving convergence of our calculations even by changing the width of our smearing scheme.
Conclusions
We can see that DFT calculations have a hard time at estimating the DOS and band gap of insulating materials. Thus, it is necessary to have extra caution while doing predictions at these energies.
The determination of the DOS and band structure strongly depends of the density of k points that we use in our calculation.
By introducing the spin orbit interaction we have been able to qualitatively predict the insulating behavior of Al2O. Nevertheless, we have not been able to quantitatively predict its band gap given that our result (0.69 eV) is roughly half the actual experimental value (1.3 eV) [5].
References
[1] C. Kittel. Introduction to Solid State Physics, 7th Edition. Wiley
[2] J. P. Perdew K. Burke, Y. Wang. Phys. Rev. B 57, 14999 (1998)
[3] Perdew, J. P; Burke, K; Ernzerhof, M. Phys. Rev. Lett. 77, 3865-3868 (1996)
[4] Sholl, D. & Steckel, J. A. Density Functional Theory: A Practical Introduction. (John Wiley & Sons, 2011).
[5] Allen, J. P., Scanlon, D. P. and Watson. G. W. Phys. Rev. B 84, 115141 (2011)

Dear Professor
Can you kindly give me the reference paper from which you have obtained the structure of Ag2O..