Part 1: Warm-Up Assignment.
After seeing a lot of fantastic and colorful infographics I chose only three from from them to be on my blog. I chose them based on what I like to read about when I have free time.

Source: http://www.compoundchem.com/wp-content/uploads/2014/01/Colourful-Chemistry.png
Chemistry is the best subject for me, I always enjoy studying chemistry even it is hard sometimes but chemistry always has something to make me feel happy about what I am studying. In chemistry I see what are the tiny things that make what is around us. This infographic shows the Acids and Bases indicators and some other minor stuff that are under Acids and Bases. In term of design, this infograpic has a lot of colors but these colors are shown when an indicator is put in an acid or a base solution so this infographic make a very good summary about these indicators and the colors that may appear. The organization of this infographic makes it better to understand for students. The using of white color in the back ground makes every color appears clearly so the feature of negative space is used appropriately.

Source: http://www.graphs.net/wp-content/uploads/2012/10/Worlds-Education-in-Numbers.jpg
Reading the facts about the things around me is something essential in my daily habits. This infographic gives a lot of facts about education in the world. These facts help to improve education in the world, specifically in the U.S. In term of design, this infographic has awesome colors that pulls readers’ attentions for each box. Also, the arrows between some boxes make it easier for the readers to follow the pattern that makes them read the information provided in order. The balance of the white color with that font makes all the information has the same importance. Some words are in bold because they are names or number which make the information more reliable.

Source: http://www.loveinfographics.com/wp-content/uploads/food/2011/11/salad-facts-and-statistics-food-infographic.jpg
Having a good background about healthy food must be a common thing among people since a lot of people have bad health nowadays and that make their lives harder. This infographic is very simple but it shows how the percentage is very low among Americans who eat these healthy food in the U.S. In term of design, as I said it is very simple but it is very explicit and precise about the facts that are shown. The organization makes it more enjoyable to read since the pictures of the food in the middle and the information in the sides. The colors of the fonts are chosen appropriately because all the colors are based on some food colors.
Part 2: Main Assignment:
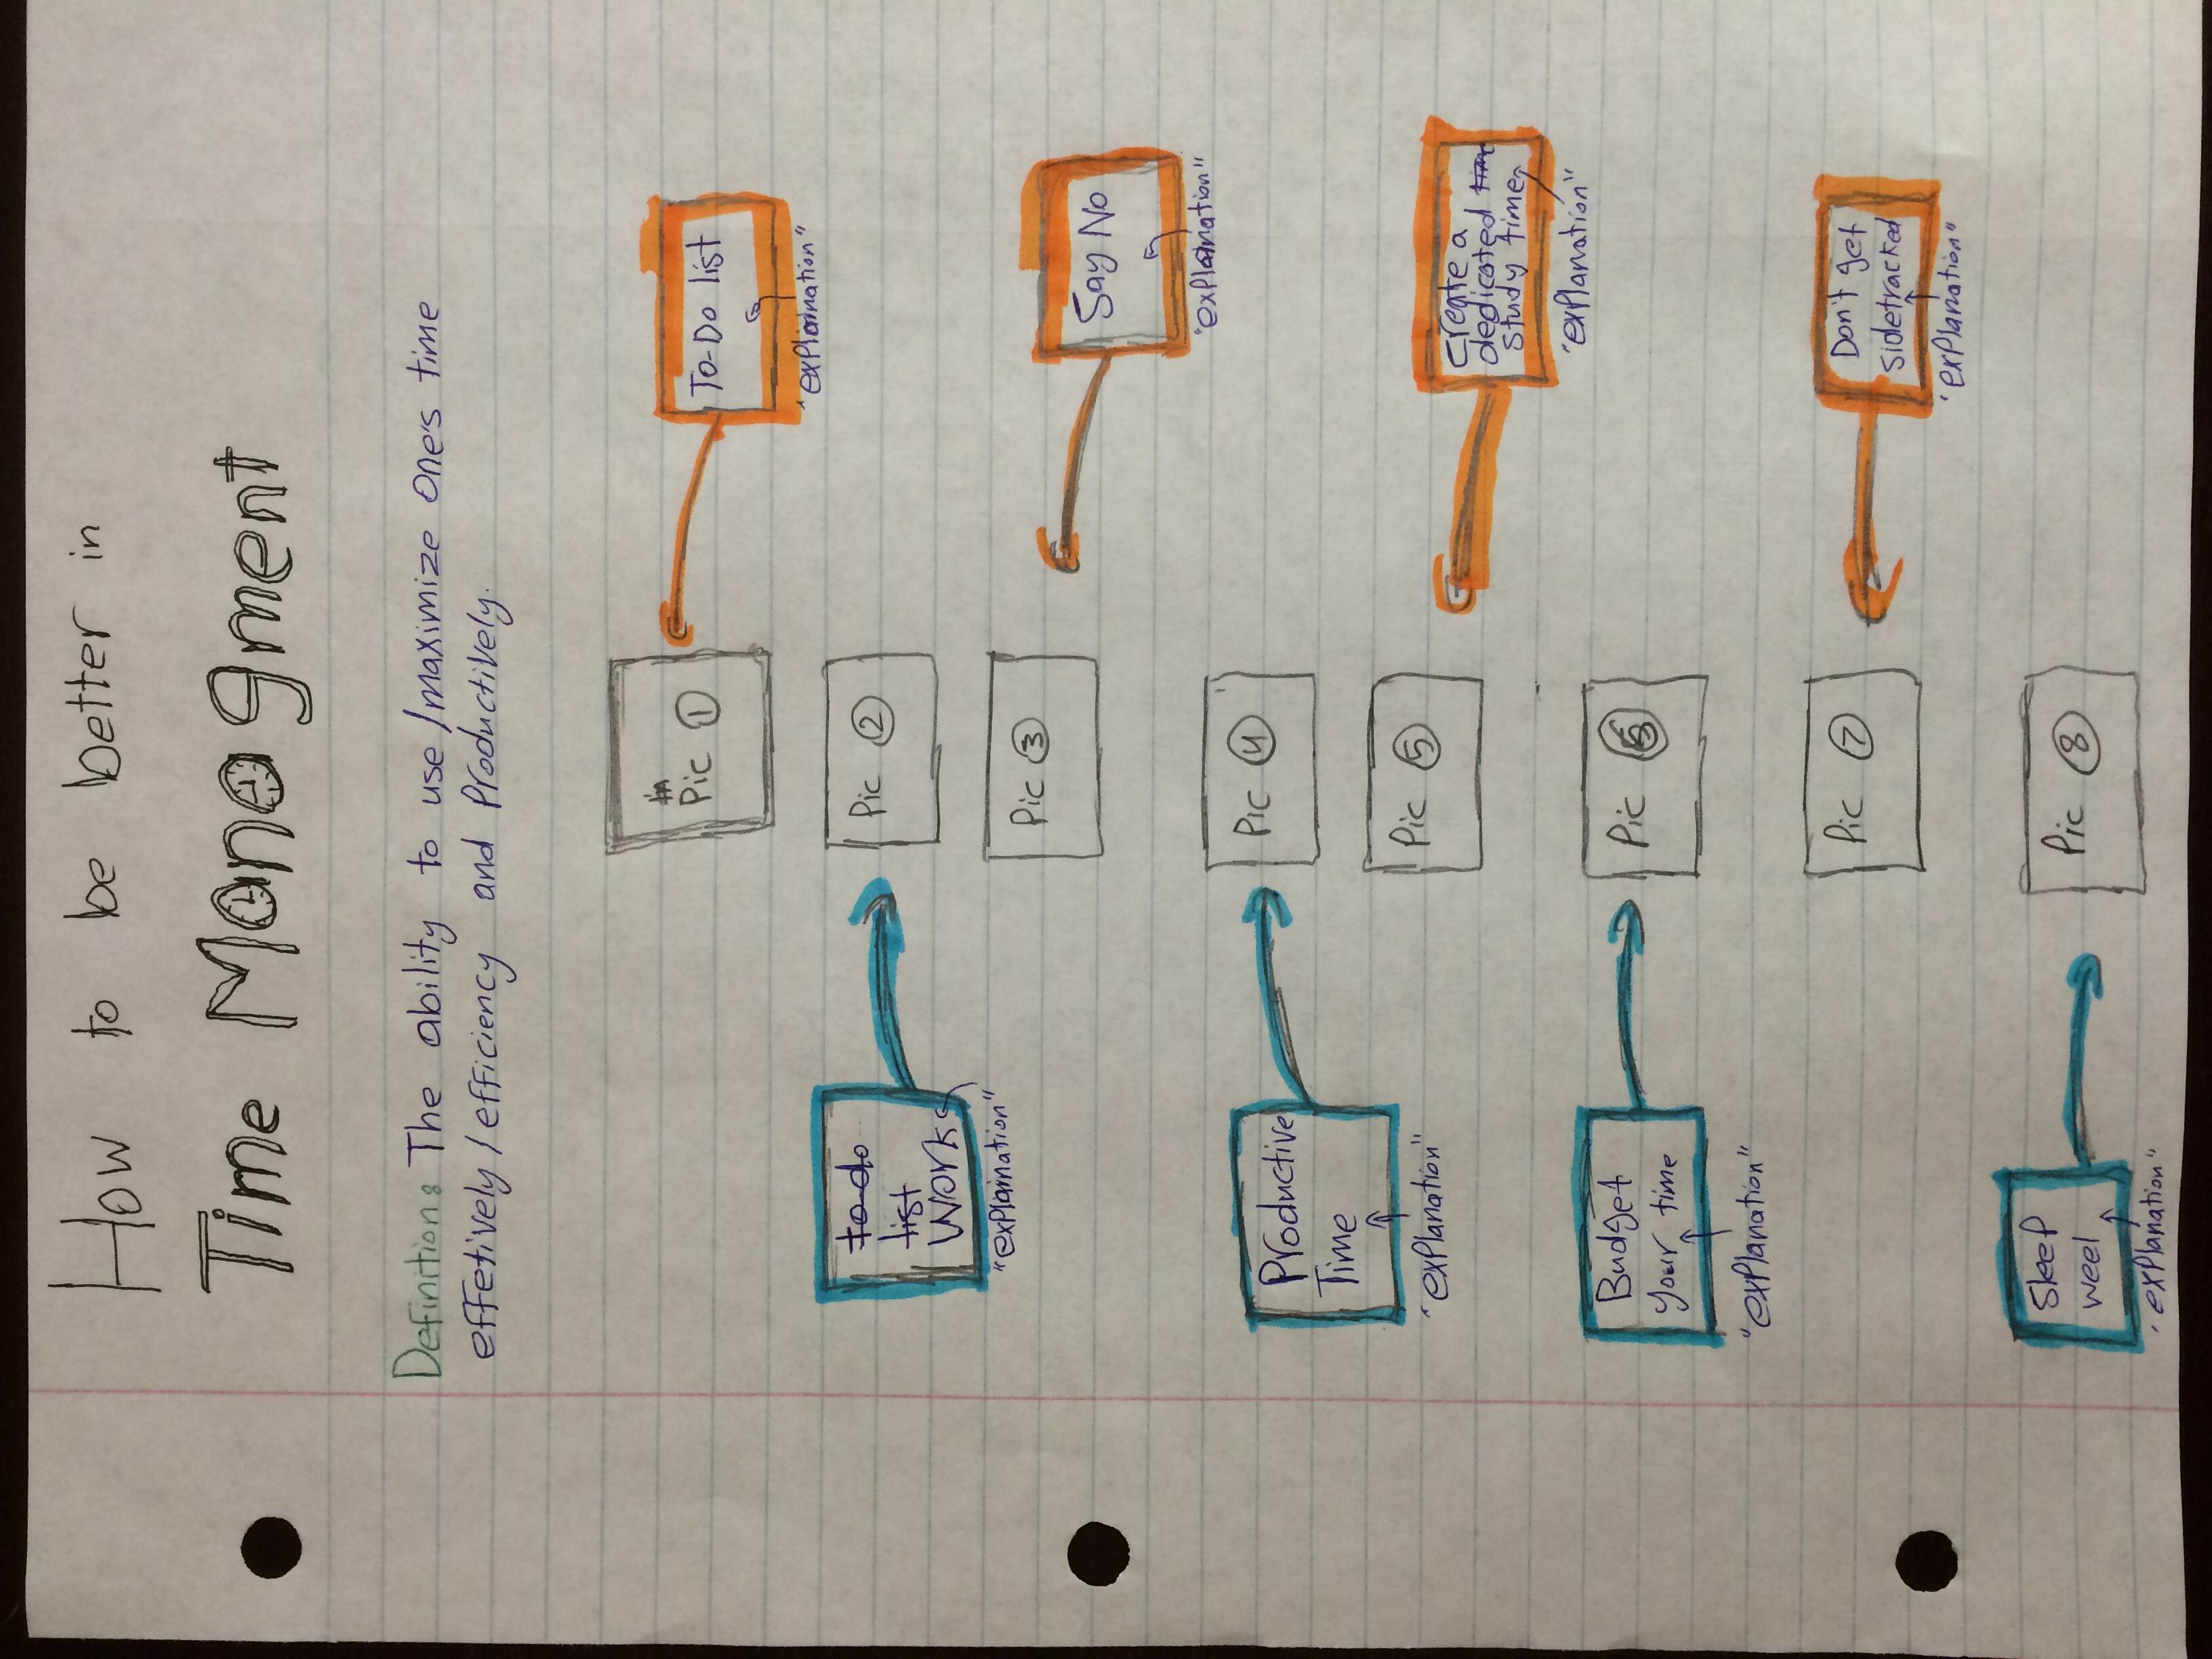
For this assignment I chose to make an infographic about time management because I struggled a lot before I started to have an acceptable skill in time management. I read a lot of articles about time management and how I should make my every day schedule in order to finish all my daily assignments and at the same time having time to practice my hobbies and take care of my health.
Time management is one of the principles for being a good college student since the amount of work and assignments is very huge. Therefore, without a good organization of time and priorities a lot of time will be wasted and lake of sleep will be one of the daily habits or instead of being a good student just do the minimum in order to survive and not to take the course again.
I will rely on some sources to make the infographic that helped me to be better in time management. I chose the APA style becaue it is more common in the U.S. than MLA.
Bibliography:
1- 8 Ways to Take Control of Your Time. In bigfuture.org. Retrieved June 19, 2014, from https://bigfuture.collegeboard.org/get-started/inside-the-classroom/8-ways-to-take-control-of-your-time
“That way, if you find yourself with extra time—while on the train or bus or waiting for an appointment—you can get something done.”
2- Nemko, M. (2014, April 3). 6 Secrets to Making the Most of Your Time. In psychologytoday. Retrieved June 19, 2014, from http://www.psychologytoday.com/blog/how-do-life/201404/6-secrets-making-the-most-your-time
“The key is having a little voice on your shoulder always asking you, “What’s the most time-effective way to do this?” Not the fastest way, not the best, but the most time-effective—the way that will yield the greatest benefit per moment spent.”
3- Time Management (2007). In Counseling Center. Retrieved June 19, 2014, from http://www.counselingcenter.illinois.edu/self-help-brochures/academic-difficulties/time-management/
“Keep things you need in your work area and make sure the physical environment is conducive to concentration, not just comfort”
4- Time management series. In Study Guides and Strategies . Retrieved June 19, 2014, from http://www.studygs.net/timman.htm
“As your school term begins and your course schedule is set, develop and plan for, blocks of study time in a typical week.”
5- White, D. 6 Tips to Improve Your Time Management Skills. In psych central. Retrieved June 19, 2014, from http://psychcentral.com/lib/6-tips-to-improve-your-time-management-skills/00015735
“There is no point in setting deadlines if you make executive decisions to always push them back.”
Summary:
I have read all these sources before I became a little bit good in time management. These sources are helpful because some of them based on researches. The articles in these sources explain time management in few common steps and tips that will help people how they should make their schedules in order to use every hour wisely.
The first, the second and the fifth sources give very simple steps and tips that everyone can handle easily and gain them by practicing. For example, making a to-do list and have a good night’s sleep are two tips that everyone must get use to do them everyday. Each source gives different number of steps or tips but eventually all of them have the same purpose. However, each source has different way to explain the steps and different facts why these steps are important to be good in time management.
The third and the fourth sources are basically researches that have been done in some strong universities in the U.S. about how students can be better in time management. The third source is done in University of Illinois, this source is the best of all these sources because it elaborates time management from a different prospective and it encourages people to follow this method more than the other methods because it provides the wrong thoughts and steps that some students use and they still face inefficient time management. Then it moves to the steps that students should use and explain each one in depth why they are the best steps to follow.
There is no specific images to describe time management, however I can use my imagination to make a good collection of images to describe the steps that I want to write in my infographic.

Source: http://blog.anymeeting.com/wp-content/uploads/2012/01/To-Do-List.jpg
This image will relate to the first tip which is “Make a to-do-list every day.”

Source: http://bminusblogs.files.wordpress.com/2013/03/work.jpg
I will attach this image to the second tip which is “Keep your work with.”

Source: http://info.zsassociates.com/Portals/147253/images/YesNo.jpg
This image will be for the third tip which is “Don’t be afraid to say no.”

Source: http://cdn.liquidplanner.com/wp-content/uploads/6320673.jpg
I will connect this image with fourth image which is “Find your productive time.”

Source: https://www.choosenmove.org.uk/NovaWeb/Infrastructure/ViewLibraryDocument.aspx?ObjectID=182
This image will be connected to the fifth tip which is “Create a dedicated study time.”

Source: http://www.asis-it.com/Content/Images/Workforce/schedule.jpg
The sixth tip will be connected with this image since it says “Budget your time.”

Source: http://ashleyberges.com/wp-content/uploads/2013/10/SIDETRACKED.jpg
This image will be related to the seventh tip “Don’t get sidetracked.”

Source: http://www.colourbox.com/preview/3461205-871812-sleeping-emoticon.jpg
The last tip which is “Get a good night’s sleep” will be connected with this image.

Source: http://productivityjunkies.com/wp-content/uploads/2010/10/GetStartedTimeManagement.png
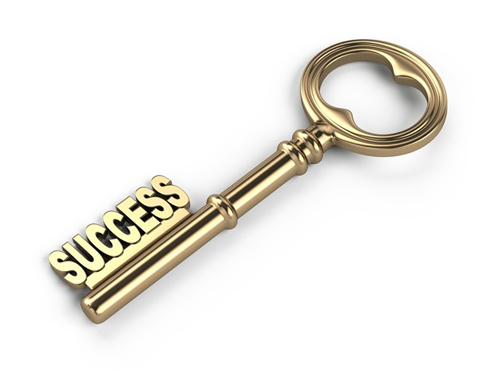
Source: http://noahfineart.com/wp-content/uploads/2013/05/bigstock-Key-to-success-24060560.jpeg

Source: http://www.hercampus.com/sites/default/files/styles/full_width_embed/public/2013/11/09/student-time-management.jpg?itok=l-aO0bkG
Explaining my drawing of the infographic.
Being better in time management is one of my daily goals because the better the time management the more time I have to finish other work and the more time I have to relax. After reading many articles and watching few videos about this topic, I have a good knowledge and background about time management.
Time management is the skill that most college students face difficulties to obtain because of the amount of work they have and the outside distractions. In my point of view, this skill is the most important skill that students have to know because time management will save a lot of time for them and help them to promote their grades in the courses they take and at the same time they can have fun because they use every hour wisely.
My purpose behind making an infographic about time management is that most of my friends and classmates cannot handle their schedules appropriately. I see most of them working all the night in order to finish their work sometimes. Since I have a good background about this skill and I can put the most important steps and tips in one image, I decided to make an infographic for them in a fancy way so they can enjoy reading it and hopefully they will become better in time management.


Draft 1
Draft 2
My infographic will explain the 8 best tips, in my opinion, to be better in time management and it explains each tip in more detail. I will use the sources that I attached previously in this page to explain each tip by combining best explanations from all the sources. Most of the 8 tips that I am going to use on my infographic are common among all the sources but each source has different way to explain each tip.
I will try to show my purpose in this infographic as simple as I can in order to make it understandable easily for everyone and enjoyable to read. Also, I will try not to provide a lot of information in the infographic because it will be boring to read and some people may not read all the steps the explanations.
The images that I attached above, will give hints for the readers before they start reading the explanation of each tip in the infographic.