Category Archives: Passion 2 Blog

Search, Research, and Research

When you do research, you’re not just researching your topic: you’re researching yourself, and learning how you work best. I’ve learned lab techniques this year, yes, but none is as important as these two acquired lessons: my interests are labile, and read up on lab literature before joining a lab. I want to switch labs, and I will remember these lessons when making that switch.

Research

How did I initially decide to work in Dr. Wang’s lab? “I do research in epigenetics,” said Dr. Wang on the first day, a Monday, of my BMB 251H class last fall. “I’m interested in epigenetics,” I thought, and subsequently asked if I could visit his lab. On Tuesday, I was sitting in Dr. Wang’s office, conversing about notable undergrads with whom he had previously worked, who were now in prestigious medical or graduate programs. Starting by shadowing Jinquan in September, I embarked on her research on a protein called HDGF2. However, on the penultimate day of fall semester, I took Dr. Wang out to lunch and said that I felt that I’d been in his lab for a semester but had no real responsibilities, and that I was having trouble committing to a regular schedule. He said that I could have more responsibility next semester (as in this one, almost past) and schedule weekly lab time, just as my classes are scheduled weekly. On that optimistic note, I went on winter break.

Over break, I read some of Dr. Wang’s papers to learn background information for my research this semester. But I was also searching for summer research. After realizing that my trip to China to take BMB 252 precluded me from most summer research programs, I found an email from SHC Career Development inviting undergraduates to work in Dr. Costas Maranas’s lab. His lab uses computers to design proteins which, when incorporated into bacteria, would enable them to produce biofuels and other valuable chemicals from methane and organic waste. An incentive: Dr. Maranas was offering a stipend, while Dr. Wang was not, and subletting an apartment in State College over the summer would cost money. Thus, I emailed Dr. Maranas, read two of his papers, and met with his graduate students; they informally interviewed me and judged that I would have sufficient background knowledge and programming skills by mid-June to contribute to the project. One graduate student was applying for a grant that required that two undergrads collaborate on his project, so he added me to the list, and just like that, I was committed to the lab for the summer, the day before spring semester began.

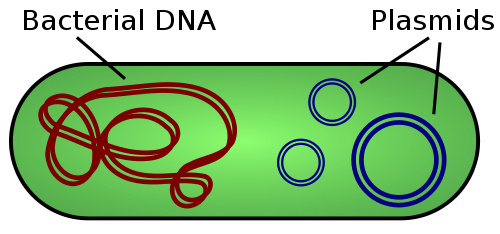
The first two weeks back in Dr. Wang’s lab were great. I had floundered the previous semester, learning (by which I mean failing, mostly) to insert a circular piece of DNA called a plasmid into E. coli, grow the E. coli to generate a lot of plasmids, and then extract the plasmids from the E. coli. The second week, though, as classes were still yawning awake, I planned how I would use every chunk of free time to do every step towards generating that DNA in E. coli. I ran to lab in the morning, set up a reaction, ran to class, to lunch, to class, and back to lab; it was stressful, like being a lab mouse in a maze. But in five days, I had two tiny tubes containing the right plasmids dissolved in water, as well as a swelling of pride: more than I had accomplished my first semester, I had done in a week. At that moment, I was quite sure I had a bright future in Dr. Wang’s lab.

That satisfaction, however, never came again. As classes accelerated, I could not manage to devote most of my non-class time in subsequent weeks to research. The plasmid extraction part of the project finished, I looked forward to the next part: putting the plasmid into bone cancer cells and measuring how it affected their gene expression via western blotting. Jinquan had to do those steps. Meanwhile, she had told me to read up on HDGF2 protein for another project, so I read some papers, but that project was on hiatus, as the mice missing one copy of the HDGF2 gene would take a month to produce mice missing both copies. (Genes are italicized; the proteins they encode are not.) I kept drifting from project to project; not committing to any one, I was not significantly learning, progressing, or feeling satisfied. The work was stressful; I never felt like I was doing well enough to please Jinquan since the week I made the plasmids. I was lonesome, working without a fellow classmate with whom I could discuss the research and have fun outside of the lab. Moreover, the specific projects of Dr. Wang and Jinquan were interesting me less and less.

What was replacing them? Microbiology, auspiciously. Before I even applied to Schreyer, I remember looking at the list of Honors courses and thinking dismissively, “Oh, I can take Honors Microbiology. Are there any classes about nutritional biochemistry?” How do you tell a good class? It changes your mind. My Microbiology 201H and Microbiology 202 lab classes have switched my interests from eukaryotic (animal, plant, fungal) to prokaryotic (bacterial, archaeal) biochemistry in only three months. Although I am still interested in human biology, I recognize now how much microbes profoundly affect human health. It startled me that our ways to identify and kill pathogenic microbes are much more tenuous than I imagined, and that resistant bacteria are on track to vitiate our last reserves of antibiotics. I thus attended a screening of The Resistance, a documentary about antibiotic resistance that would compel any biologist to switch to that field.

Microbes relate in more ways to human health. I attended a lecture here, given by University of Colorado Boulder professor Rob Knight, about how the bacteria living in our intestines profoundly affect our risk for developing obesity and other chronic diseases, but that we have only superficial knowledge of how they do this, or even what bacterial species are living there. Writing a term paper for Microbiology 201H, I learned that the microbes in our intestines even regulate our appetite. Some bacterial species not only thrive when we eat too much but also can compel us to eat too much; if they gain a stronghold, they can flourish as they make us gorge to obesity.

A little more indirectly, but no less pressingly, microbes affect human health via their potential to purify water, generate electricity, recycle waste, and produce valuable chemicals. Producing sufficient energy, water, and food are likely the three most important problems now facing humanity, even more important than cancer epigenetics (the focus of Dr. Wang’s lab), or even antibiotic resistance and obesity. If we could use unlimited energy to distribute unlimited potable water and nutritious food to everyone in the world, we would reduce malnutrition, poverty, obesity, and other chronic diseases, as well as infectious disease, which often spreads in third world nations via contaminated water, and which the aforementioned ailments exacerbate. Microbes have a role: in Microbiology 202 lab, we produced 0.3 milliwatts of electricity by packing two wires and some normal bacteria-laden dirt into a plastic jar. One Penn State professor can generate somewhat more electricity: Dr. Bruce Logan is one of the world experts on microbial fuel cells, and I am interested in visiting his lab this summer, possibly to work in his lab next fall. However, as I said at the beginning of this post, I will give his lab thought before I interview to join.

In my desire to switch labs, I have been visiting other labs and reading their background literature. Dr. Gong Chen recently made a breakthrough in repairing brain injuries; I interviewed him about and read some of his papers, but I decided that his research is not as quantitative as I would like, and that the projects his lab is moving towards—murine behavior tests—are not my passion. Dr. Miyashiro, my Microbiology 202 lab professor, is doing work with host-microbe symbiosis in squid (the human microbiome is a type of host-microbe symbiosis, too), but I visited his lab and again do not think the research is quite right. However, I am looking forward to Dr. Costas Maranas’s lab this summer. Working on a coding project this semester, I have realized that coding things on computers is one of the few activities that will keep me up until 3 AM (twice!). Add that I enjoy physics, chemistry, and biochemistry, which are integral to protein design and metabolism. Add that the mission of the lab is to design bacteria that recycle organic waste into useful chemicals, and I have more than a hunch that I will enjoy the work.

Do I know for sure? No, but I need to do research to learn if this is work I enjoy. I know my mission: make health sustainable. I do not know my approach, which is unsettling, but also exciting. As I am scoping it out, and indeed, as you too are figuring out what you want to do, I think that a good take-away message is this: always pay attention to how well the work fits you. Does it fulfill you? Aggravate you? Cut into your hours for friends, fun, or sleep? Do you have to force yourself to do it, or do other people have to pull you away from it? Don’t shoehorn yourself into something you hate, because you can find what you love. How? Search, research, and research.

Who makes doctors look smart?

When your doctor takes a blood sample or a throat swap, then gives you the results some time later, you probably think little about who actually analyzes those samples. But without these people—clinical lab technicians—working inconspicuously, doctors would not be able to determine your blood sugar, test you for strep throat, or do any other kind of chemical test.

I toured the clinical lab at the University Health Services and observed the techniques that the clinicians use to analyze samples of all sorts. Say that you come into UHS with a sore throat. A lab technician will take your throat swap and spread it onto a Petri dish full of a type of food called MacConkey agar, then incubate the dish for several days. Only gram-negative bacteria can grow on MacConkey agar; a common cause of strep throat, Streptococcus pyogenes, is gram-positive, so growth on MacConkey agar rules out this bacterium as the infectious agent. If there is no growth, the technician will culture the bacteria on another plate containing blood agar, which is opaque red; if the bacteria make the agar transparent, they are likely S. pyogenes.

Streptococcal_hemolysis

Streptococcus growing on blood agar in section marked “β.” Y Tambe. Wikimedia Commons.

If the infection is less clear, the technicians will culture the bacteria in a plastic plate that contains over 100 wells, each filled with a different chemical, such as glucose or lactose, and a dye. As the bacteria grow, they consume specific chemicals, causing certain dyes to change color; each species produces a characteristic pattern of color changes that the technician can use to identify it. For example, most Escherichia coli strains ferment glucose, but not sucrose, producing acids that cause the dye to change color in only the glucose well, while most Pantoea ananatis strains ferment both sugars, changing the color of both wells. This way, technicians can distinguish between bacterial species.

To diagnose other conditions, infectious and not, technicians will examine almost any body fluid microscopically. Say that you are having blood work done. The clinicians will take a small amount of blood and feather it out onto a glass microscope slide. I was allowed to inspect a sample at 1000x magnification, at which point red blood cells were visible as indigo ovals with pale centers and white blood cells were purple, more irregular blobs. The white blood cells were pressing up against the red blood cells, which is indicative of mononucleosis. I also was able to inspect a urine sample that a technician had placed into the narrow gap between two plastic plates, much like in a hemocytometer. I saw tiny X-shaped crystals of calcium oxalate, which can constitute urinary or kidney stones, and thus its appearance in the urine is a warning sign.

Infectious mono

White blood cells (purple) pushing against red blood cells (pink), indicative of mononucleosis.

The heart of the diagnostics, however, is the array of test strips. To accurately test for mono, for example, the technicians take a piece of plastic that encloses a strip of paper treated with chemicals that change color upon exposure to molecules in the blood. They put a drop of blood through a hole in the plastic and onto the test strip; as the blood diffuses across the strip, it causes one or two spots to turn purple. One spot is the positive control: it should turn purple whether or not the patient has mono, and if it stays white, the test result is void. Assuming the control works, a color change in the other spot indicates mono. Technicians test for many conditions, such as pregnancy, with test strips like these.

Test Strip

A cartoon test strip, showing positive, negative, and invalid results.

When the change in color is not “Yes or no?” but rather, “How much?” technicians place the treated test strip into a machine called a colorimeter that accurately measures the color. (In the past, technicians had to estimate the colors with their own eyes.) For example, blood glucose test strips have a red circle that changes color when exposed to glucose; the more glucose, the more the color changes. A colorimeter about a meter cubed reads the test strips for glucose and triglycerides. I realized that many times in my nutrition blog and issue brief, I had talked about blood glucose and triglycerides, but never had I wondered exactly how they were measured. But seeing the colorimeter that does the job was fulfilling nonetheless.

What struck me most about the clinical lab was its reliance upon prefabricated chemical tests. Test strips, colorimeters, bacterial well plates—they all come ready to use, and this gave me new respect for the industry that mass-produces these diagnostic tools and makes them ever more efficient. The technicians told me that there are fewer schools that offer programs in clinical lab work now than there were twenty years ago, and that few people are entering this field; consequently, there will be a job shortage in ten years if trends continue. Though job prospects are promising and the median salary is about $57,000, I do not think that I would like to be a clinical lab technician. I recognize their importance in diagnostics, but I would like to go into a research career focused more on developing new technology or knowledge. But, as always, ruling against a potential career still helps me to decide what I would likely rather do.

PowerProtocol

Learning lab skills is half of the battle; I also have to learn how to learn lab skills, and learn them as time-efficiently as I can. Thus far, I have learned that simply observing Jinquan perform a procedure while asking questions occasionally is not effective. Writing down the details of the procedures helps, but is it best to write down the steps as Jinquan performs them or after she finishes? Though writing in real time minimizes the number of details that I miss, it is unfeasible for some techniques, such as exposing film in the darkroom. Ideally, I would do both, recording the details in the lab and reviewing them afterward.

So that I would better learn how to perform a western blot, Jinquan asked me to make a PowerPoint explaining the process (which you can download here). I typed out 38 slides by myself and then explained each in turn to Jinquan as she commented and corrected my errors. Creating PowerPoint slides helped me learn the details, but not as much as performing all of the steps would have.

Creating the PowerPoint was conducive to learning because I could work at my own pace and make errors. I become anxious when someone scrutinizes my performance as I am learning a new skill; at least, I do if they hastily correct my mistakes. I learn best from the innate consequences of my own failures—a protein gel that leaks out of the bottom of its mold—than I do when I am corrected before I am able to fail at all. Still, I need some sort of feedback to learn, whether it is from a leaky gel or a person. Jinquan gave me feedback on the PowerPoint, correcting my factual errors, and thus I was able to both work at my own pace and receive feedback—a plus on both accounts.

Using my time to make a PowerPoint instead of practicing an actual western blot, I did not, of course, improve my lab technique. To learn a physical task, there is no substitute for performing it; as I still have not completed a full western blot by myself; I would not say that I can perform one yet, whereas, had I instead successfully gone through a full western blot instead of making slides, I would. However, the upside was that I could practice going through the steps without the risk of wasting expensive reagents, such as antibodies.

Working in PowerPoint, I now have an accurate guide for western blotting that I can reference for future use, which could help me on subsequent western blots. The potential caveat while making the slides was the temptation to overdo the visuals. Jinquan had specifically told me to focus on content and avoid visual detail, and for the most part, I avoided fiddling with margins and fonts, but I did spend more time than I needed to making a diagram of how antibodies bind to the protein membrane.

There are definite merits of making slides to learn procedures, but I think that the most effective way in which I learn techniques is by first performing them while observing Jinquan doing them, writing down steps if possible, and later on, rewriting notes or making slides. I find both non-critical, hands-on feedback and subsequent review to be essential for learning lab procedures best.

Small interference; significant interpretation

To discover what something does, often we remove it and observe what changes. This is especially true in biology. Jinquan observed that under certain conditions, cells start producing a lot of a protein called ATF4. Proteins in cells are frequently linked in pathways, wherein one protein turns on another protein, which turns on another, and so on, until the final protein actually carries out the cells’ responses to a stimulus. Jinquan wants to figure out if ATF4 turns on several other proteins in a pathway. If she can make some cells stop producing ATF4 while allowing other cells to produce it, and then show (using western blotting, discussed previously) that the cells without ATF4 are producing less of those other proteins than the cells that are still producing ATF4, then she has evidence that ATF4 is part of that pathway. But how to turn off ATF4 protein?

RNA interference is one method we use to stop making a protein. Normally, to make a protein, a cell first uses the DNA segment encoding the protein (a gene) to create a piece of RNA, a molecule similar to DNA, in a process called transcription. This type of RNA, which codes for a protein, is messenger RNA (mRNA). The cell then uses a large group of molecules known as a ribosome to read the mRNA and make a protein from its code of bases, a process called translation.

DNA → mRNA → protein

Eukaryotic cells (cells with nuclei, such as those of all macroscopic organisms) have evolved a way to prevent the translation of a specific protein by destroying the mRNA encoding it: RNA interference. RNA interference is useful in the lab, where we can use it to dramatically reduce the amount in which a cell produces a specific protein, and, by observing the differences between cells with and without the protein, infer the protein’s function. We can induce RNA interference by adding, or transfecting, another type of RNA called small interfering RNA (siRNA) into cells. siRNA, like DNA, is a double-stranded helix, but, unlike DNA, is automatically chopped up into small fragments by a protein called Dicer. Then, a collection of proteins known as an RNA-induced silencing complex binds to each fragment, discards one strand of siRNA, and displays the strand it retains. Just like two complementary DNA strands in a double helix bind together, mRNAs that have sequences that match the siRNA sequences will bind to the siRNA. A protein called Slicer (or Argonaute), part of the RNA-induced silencing complex, then cuts up the mRNA, preventing it from being translated into a protein. RNA-induced silencing complexes can work over and over, degrading many mRNAs, and shutting down the production of the protein that the mRNA encodes. For an in-depth video on RNA interference, follow this link.

Mechanism_of_RNA_interference


Simone Mocellin and Maurizio Provenzano: Mechanism of RNA interference. Wikimedia Commons. Here, the double-stranded siRNA (abbreviated dsRNA) is chopped by Dicer to form siRNA fragments, which associate with the RNA-induced silencing complex (RISC) and cleave mRNA (blue) into fragments, preventing translation.

Earlier this week, I watched Jinquan transfect cells with siRNA that specifically targets the mRNA that produces a protein called ATF4. A day before the transfection, Jinquan had cultured the cells she wanted to transfect in 4 plastic wells.

Two wells would be transfected with siRNA for ATF4. To prepare this siRNA, Jinquan added in one tube 8 microliters (µL) of siRNA for ATF4 to 200 µL of a special siRNA transfection medium containing solutes that facilitate the transfection. Next, to 200 µL of siRNA transfection medium in a second tube, she added 10 µL of siRNA transfection reagent, which binds to the siRNA and helps to carry it into the cells. She pipetted the dissolved siRNA into the transfection reagent tube and waited 30 minutes while the two bound together.

(8 µL siRNA + 200 µL medium) + (10 µL transfection reagent + 200 µL medium) =  ~ 400 µL

To understand what the lack of ATF4 does, cells without ATF4 must be contrasted with cells with ATF4—the negative control cells. To make sure that any differences between the negative controls and the transfected cells arose from differences in ATF4 levels, and not from the process of transfection itself or the addition of the transfection reagent, Jinquan also mixed 10 µL of transfection reagent with 400 µL of transfection medium.

10 µL transfection reagent + 400 µL medium = ~ 400 µL

Using a small vacuum pipette, Jinquan sucked out the liquid medium in which the cells were growing (the cells remained attached to the bottom of the plastic wells), and she washed them with transfection medium, which she removed. After adding 800 µL more of transfection medium, she pipetted the approximately 200 µL of siRNA with transfection reagent into 2 wells and 200 µL of transfection reagent alone into the other 2 wells, drop by drop, each drop in a different place. She gently rocked the wells to distribute the siRNA, then incubated them for 6 hours to let the wonders of transfection and RNA interference occur.

Now, a few days after the transfection, Jinquan is making western blots of proteins extracted from the cells. If she finds that ATF4 is much lower in transfected cells, then the transfection worked. What she is curious about, though, is whether the other proteins she suspects are part of the ATF4 pathway are much lower in transfected cells. If they are, her results will be evidence that ATF4 is upstream of the other proteins in the same pathway. Slowly, using RNA interference, the pathways of cellular proteins can be elucidated, which can lead to novel drugs to inhibit proteins in cancer pathways or to turn on more salubrious proteins.

Making a Western

A project of my own, finally. The reason I joined a research lab. Though learning lab techniques is invaluable preparation to do one’s own experiments, I had been getting bored earlier this semester when I would merely come in, ask what work there was to do, and make gels or run a PCR. Since Jinquan was planning the experiments and working eight hours or more per day, I couldn’t keep up with the progress she was making and felt excluded.

In my BMB 488 research class, which is a great way for any BMB major undergraduate to get involved in research, my classmates and I had the opportunity to present original research at the Undergraduate Poster Exhibition. My Principal Investigator, Dr. Wang, gave me five papers to get ideas; one especially intrigued me, but first, some background. Just as DNA’s ATGC base sequence encodes genes, histone proteins, which DNA is always wrapped around, carry a sequence of modifications that encodes how genes are turned on and off. An important modification is the addition of three methyl groups to the 36th amino acid—a lysine—on the third histone; this is called histone 3 lysine 36 trimethylation. Without lysine 36 trimethylation, cells cannot effectively repair DNA, accruing lethal or carcinogenic mutations.

Nucleosome

DNA wrapped around a particle made of 8 histones, forming a so-called nucleosome

The intriguing paper written by Peter Lewis et al. showed that when cells are given DNA coding for a mutated histone 3, in which lysine 36 is replaced by another amino acid—methionine—virtually all lysine 36 trimethylation disappears, even on normal histone 3s; such a mutation could precipitate cancer. I want to figure out why the methionine histones abrogate lysine 36 trimethylation. Given that I have two weeks before the poster session in which to do experiments, I don’t expect to solve the mystery, but I do plan to test several hypotheses—namely, that the methionine histones affect how much the cells produce certain proteins. To measure the levels of proteins, I will need to use the lab skills I have been learning but will also need to learn a new skill: western blotting.

Western blotting (named after Southern blotting, which is named after Edwin Southern), is a way to see if a cell culture is producing a protein and, if so, to estimate how much. I have watched, but not performed one myself, so I am referencing this and this other protocol from Abcam.

Step 1: Extract the protein. All of the first steps should be done on ice with ice-cold liquid media. Start by washing the cell culture dish with phosphate-buffered saline solution, aspirating, and then adding a lysis buffer to split the cells open and release the proteins within. Scrape the cells out of the dish, transfer them to chilled microcentrifuge tubes, and then agitate them for 30 minutes, to ensure all cells lyse. Centrifuge the tubes at maximum speed for 20 minutes to precipitate large fragments of the cells in each tube into a pellet at the tube’s bottom, while leaving the proteins, too light to precipitate, dissolved in the supernatant—the fluid above the pellet. Pipette the supernatants into new tubes.

Step 2: Denature the protein. Aliquot 50 µL of the contents of each tube and measure the concentration of protein in each 50 µL sample. Then, unless otherwise specified, add sodium lauryl sulfate (to give the proteins a negative charge) and beta-mercaptoethanol (to break disulfide bonds that hold proteins together), and heat the tubes to 100°C for 5 minutes to denature the proteins. This changes the proteins from their highly specific shapes to linear chains of amino acids, necessary for the next step.

Step 3: SDS-PAGE Electrophoresis. As the cell extracts have many proteins, different proteins must be separated in order to determine how much of each is present in the cells. To do this, take a previously prepared polyacrylamide gel with a number of slots on top. Load an equal mass—20 to 30 µg—of each protein sample into a slot atop the gel, and then place the gel vertically in a machine that gives puts the top of the gel at –50 volts and the bottom at +50 volts for 1 to 2 hours; this is called electrophoresis. Since the proteins have negative charges, they will move down towards the positive voltage, and the larger the protein, the more it will bump up against other molecules in the gel, so the slower it will run. After the gel is finished running, the proteins will be separated based on size, and smaller proteins will have moved further from the starting wells. Additionally, a so-called protein ladder, comprising proteins of known size, is loaded into one slot; the distances that each protein in the cell samples run are compared with the markings on the ladder to estimate the size of each protein. The proteins, however, are invisible, so they must be stained before visualization.

Load_a_sample_into_a_polyacrylamide_gel_electrophoresis_chamber

Photo by rox. Loading a protein sample into a gel for electrophoresis.

Step 4: Blotting. Blotting transfers the proteins from the gel to a nitrocellulose membrane on which the proteins can be stained. Cut the slots off of the gel, and then, on the flat blotting machine, place, in turn, moist filter paper, the gel, the membrane, and more moist filter paper, close the lid, and place a heavy weight on top to press the gel and membrane together. The machine applies a voltage, but this time, the positive voltage is on top, so that the proteins move upward, out of the horizontal gel and into the membrane. After the transfer, briefly stain the membrane with Ponceau Red, which binds to proteins, to determine if the blotting worked.

Step 5: Antibodies. Ponceau Red binds to all proteins; to determine if there is a specific protein that the cells produced, antibodies, which bind to only one type of protein, are used. First, “block” the membrane to prevent random antibody binding by rocking the membrane back and forth for 1 hour at 4°C in a protein-rich fluid, such as skim milk or BSA. Wash off the blocker with TBST and add a solution containing a primary antibody, which binds only to the protein that you want to detect, and rock it back and forth it with the membrane for 3 to 18 hours, depending on the protein, and probably at 4°C. Finally, wash off the primary antibody with TBST and add a secondary antibody, which not only binds to the first antibody but also carries a molecule that fluoresces when exposed to UV light. Rock it back and forth it for 1 to 2 hours at room temperature.

Antibodies

Diagram by Imoen. Antibodies in western blotting: B is the blocker, A is the protein of interest, “Rabbit anti-A” is the primary antibody that binds to A, and “Goat anti-rabbit” is the secondary antibody that binds to Rabbit and also carries the fluorescent tag.


Step 6: Imaging. Finally, with the fluorescent secondary antibody bound, the membrane is ready to be imaged. There are several ways to do this, but in our lab, we take the membrane to a darkroom, and place it in a UV emitting machine along with film. The UV excites the secondary antibody, causing it to fluoresce and release light onto the film, developing it. Wherever the film turns black, secondary antibody had bound, and, if everything went well, the protein of interest had also bound.

Using western blotting, I aim to determine if the mutated histone with methionine in place of lysine 36 changes the amount in which several proteins are produced. If one or more of these proteins does change, then it will support my hypothesis that changes in these proteins’ levels abrogate lysine 36 trimethylation. If not, well, then, I have other hypotheses to test, probably after the poster session, but I will have ruled out ones that don’t work.

qPCR – SYBR green to measure a gene

If the genome is a library filled with both useful and useless information, then gene regulation is the librarian who directs you to only the books you find useful. All of the labs on the fourth floor of North Frear are trying to determine how cells find and express—that is, turn on—useful genes while repressing genes that they don’t need at the moment, or ever. Lately, Jinquan has been using a technique called either real-time PCR or quantitative PCR (qPCR) to measure how much of certain genes her cell samples are expressing. When a cell expresses a gene, it first transcribes it, which is the process of making a messenger RNA (mRNA) molecule from the DNA. Thus, if a cell has a lot of mRNA for a certain gene, it is highly expressing that gene.

To measure how much mRNA cells are making for a given gene, we first extract the mRNA from the cell and then synthesize DNA from it, which I described in an earlier post. In order for PCR to work, we need to add primers, which are short sequences of DNA that are complimentary to regions of the DNA strand we want to replicate. This is fortunate, because we only want to measure the DNA of one gene; if every strand was replicated, we would have a lot of DNA, but we wouldn’t know how much of it was for our gene of interest. Since every gene has a different DNA sequence and we know the sequence of the gene that we want to replicate, we can choose a “forward” primer that binds to the beginning of the gene and a “reverse” primer that binds to the end. Only DNA in between the primers (inclusive of the primers) will be replicated.

We add all of the reagents in qPCR to a plastic plate that has 96 wells in it. This is very useful if we want to measure the expression of several different genes, because we can add the primer for one gene to the wells in one column, the primer for a different gene to the wells in another column, and so on. Additionally, we can add DNA from different types of cells to different rows, so that way, we can simultaneously measure the expression of several genes in several types of cells. Here, we measured twelve genes, including the genes for PUMA, MCL1, and actin, in DNA samples from four different kinds of cells.

96-well PCR plate


Life technologies: “MicroAmp Optical 96-Well Reaction Plate.” A plate used to perform qPCR.

With 96 wells to fill, it makes sense to make a master mix of reagents common to every tube and then to add the specific reagent to each tube—this saves you 96 tedious pipette actions. Whether the specific reagent is the set of primers or the DNA sample from the type of cell depends on the number of genes and types of cell being measured. If you are measuring more genes than cell types, make master mixes that include the DNA from a specific cell type; otherwise, make master mixes that include the primers for a specific gene. In our case, we had four types of cells and twelve genes. If we made a master mix with the primers for each gene, we would have needed to make twelve different master mixes; instead, we made only four different master mixes by adding the DNA from each cell type to the common reagents.

The common reagents—the DNA polymerase, the free nucleotides, and the all-important SYBR green dye (more on that later)—were pre-mixed for us, so for each DNA sample, we simply added 100 µL of DNA sample to 150 µL of common reagents, making 250 µL total for each DNA sample. Since we had four cell types and 96 wells, each one occupied 24 wells; for each 250 µL mixture, Jinquan pipetted 10 µL into each well, leaving 10 µL as an error margin (no pipette measures perfectly). Then, she added 2 µL of each mixture of forward and reverse primers to each well—twelve different primer sets, eight wells per set.

After adding the reagents, Jinquan sealed the wells closed with a sheet of sticky plastic and placed them in the qPCR thermocycler machine. The thermocycler cycles through several temperatures to allow the DNA polymerase to replicate the DNA. In my earlier post on PCR, I was incorrect about the number of different temperatures used in PCR. The correct cycle is as follows, although specific temperatures and times vary slightly from PCR to PCR:

Temp.             Time                Purpose

94°C                3 min               initially denature: heat to separate the DNA strands from each other

94°C                30 sec              dentature: heat to separate the DNA strands from each other

55°C                30 sec              anneal: cool to let the primers bind to the DNA

72°C                40 sec              elongate: warm to allow DNA polymerase to replicate the DNA

72°C                10 min             finally elongate: allow the DNA polymerase to finish replicating DNA

4°C                  indefinitely      stop: chill for storage of the DNA to prevent DNA breakdown

PCR steps


Madprime: “PCR,” from Wikimedia Commons. The original DNA template is in blue, primers in red, and newly synthesized DNA in green; the DNA polymerase enzyme that synthesizes new DNA is the green circle.

While the first, penultimate, and last steps are performed once, the bolded steps are repeated for the number of times we want to double the amount of DNA. qPCR usually takes between 30 and 40 cycles. Each cycle, the thermocycler measures the amount of DNA in each well. I mentioned earlier that the master mix contains SYBR green, which is a molecule that binds to DNA. When and only when it is bound, SYBR green will emit green fluorescent light when it is illuminated by blue light. To measure the amount of DNA, then, the thermocycler emits a flash of blue light at the end of the 72°C step, and it measures the amount of green light emitted; more light means more SYBR green is bound to DNA means more DNA.

Below a certain number of DNA molecules, there will be so few SYBR green molecules bound to DNA that the thermocycler cannot detect the green light produced. Therefore, there is a certain threshold number of molecules required for DNA detection. The thermocycler measures the number of cycles that it takes to first detect DNA and calls that number the threshold cycle, abbreviated Ct. Since the amount of DNA doubles every cycle, if one gene reaches threshold one cycle later than another, there were approximately half of the number of DNA molecules to begin with, and thus half of the expression for that gene in the cell that made the DNA. If a gene reaches threshold two cycles later, it had about one fourth of the expression; n cycles later means 1 / 2n times the expression.

qPCR thus provides a way to measure the relative expression of genes in cells, although it does not measure the absolute number of DNA molecules in the original samples. Usually, the expression of each gene is compared to the expression of a reference gene whose expression varies little between different types of cells; actin, a popular choice, is the one which we used in the aforementioned experiment. Comparing the expression of a certain gene to the expression of actin, we can determine how much the cells express it and how the gene is regulated in different types of cells or cells exposed to different chemicals.

Reversing molecular biology: reverse transcription

The polymerase chain reaction (PCR) is not the only lab technique that synthesizes new DNA. In my lab, we often need to make DNA from messenger RNA (mRNA) that we extract from cells, in order to see what kinds of mRNAs the cells are making. Normally, cells use DNA to make RNA—this is called transcription. However, a number of enzymes called reverse transcriptases reverse the process of transcription, making DNA from RNA. (Reverse transcriptases are made naturally in small amounts in many plants and animals, but they are most infamously made by retroviruses like HIV.) Though I expect I will perform reverse transcription reaction sometime, I have not yet, and so I am referencing a Harvard University protocol and a Journal of Biological Methods protocol, rather than my own notes.

Step one: mRNA extraction

Starting with a dish growing the cells of interest, the first step is to extract the mRNA. First, work surfaces and equipment should be wiped with RNase ZAP to deactivate any RNases—enzymes that degrade RNA and thus render the mRNA extraction useless. Use a suction pipette to aspirate—suck away—the liquid culture medium. Add phosphate buffered saline (PBS) and swirl to wash the cells, aspirate the PBS, add more PBS, and use a rubber scraper to dislodge the cells that adhere to the culture dish. After adding more PBS and swirling, pipette the cells into a fresh, conical tube. Now, the cells are ready to work with.

Centrifuge the tube at medium speed so that the cells precipitate down to the bottom, forming a pellet. Without disturbing the pellet, aspirate the medium, then add TRIzol (a solution containing phenol), break up the pellet to return the cells into the medium, wait five minutes, add chloroform, shake vigorously, and wait several minutes for the chloroform and phenol to extract the mRNA, DNA, and proteins from the cells.

Centrifuge, this time at very high speed, to separate the cell extracts into several fractions, like separated salad dressing. The mRNA is in the top fraction, so pipette it into a fresh tube without touching the other fractions, which contain unwanted cell components. Centrifuge again at very high speed for a long time so that the mRNA itself precipitates down into a pellet. Carefully remove the liquid above the fragile pellet and wash it with ethanol. Add more ethanol, then break up the pellet with the pipette tip, and, if all went well, the mRNA is finally in solution.

Step two: DNA degradation

Biology is messy, and any purification procedure, like mRNA extraction, is likely to yield an impure product; DNA is likely to be present in the mRNA. To destroy the DNA, which could cause erroneous qPCR results if it were copied during the qPCR mix the following reagents:

DNase buffer                                                                                                                1.5 µL

DNase (an enzyme that degrades DNA, but not RNA)                                           1.5 µL

mRNA solution (from the mRNA extraction)                                                         12.0 µL

Let the DNase work at room temperature for 15 minutes, then add 1.5 µL of EDTA and heat to 65°C to stop the DNase activity.

Step three: Reverse transcription

The DNA polymerases used to copy DNA during PCR do not copy mRNA. Once the mRNA is purified, it must be converted into DNA by reverse transcription (RT). RT uses the enzyme reverse transcriptase—found in HIV—to synthesize a molecule of DNA from a molecule of mRNA, the reverse direction of normal transcription, in which RNA is made from DNA. First, add 0.5 µL of a primer, then heat to 70°C for ten minutes and place on ice. Then mix the following reagents:

RT buffer (to make sure reverse transcriptase works properly)                               25.0 µL

DTT (to protect the DNA)                                                                                                 10.0 µL

dNTP (the monomers that reverse transcriptase links together into DNA)              5.0 µL

RNAsin (to inhibit any potential RNases)                                                                         1.25 µL

Superscript II (a solution containing reverse transcriptase)                                         5.0 µL

Add 9.5 µL of this mixture to each PCR tube containing the purified mRNA. In a thermocycler, heat the PCR tube to 42°C for 90 minutes, then to 50°C and 70°C for ten minutes to allow reverse transcriptase to synthesize the DNA.

Finally, the mRNA has been converted into DNA, which can be used for several purposes, at least one of which—quantitative PCR, which Jinquan has been using a lot recently to measure gene expression—I will describe in a future post.

PCR – doubling DNA

Jinquan and I are going to use cells from six mice in future experiments. Some of these mice harbor mutations in a particular gene, and we want to see how that mutation affects the growth of the cells. First, we need to verify that the mice actually have the mutations; otherwise, we would waste weeks working with cell lines that would have the wrong genotype and, consequently, wouldn’t tell us how the genotype affects growth.

Previously, our lab had snipped off a tiny piece of the tail of each mouse, extracted the DNA from the cells, and dissolved it in water. Because we don’t want to keep snipping off tail cells every time we need more DNA, we wanted to conserve the DNA we’d already extracted by taking only a small volume of it—less than necessary to determine the genotypes—and duplicating it using a standard laboratory technique: the polymerase chain reaction, or PCR.

Though I’ve known about PCR since tenth grade Biology, I performed my first PCR reaction this week. Like many procedures, PCR involves following a previously devised formula for pipetting reagents into tubes; it is easy to perform, but you must pay careful attention to what you are doing. Since we had six mice, and I was to put exactly the same reagents—except for the DNA—into the tube of each mouse, I first made a solution that had all of the non-DNA components. Such a solution is called a master mix and has enough reagents to go into all of the individual tubes; I add an extra volume—so seven volumes in this case, instead of six—to make certain that I will not run out of master mix.

Reagent                                               Volume per mouse (µL)                      Master Mix (7x)

doubly distilled H2O                         7.0                                                     49.0

10x enzyme buffer                            1.5                                                     10.5

deoxynucleotides                              1.0                                                       7.0

DNA primers                                       1.2                                                       8.4

Pfu DNA polymerase                         0.3                                                       2.1

Total Volume                                     11.0                                                    77.0

I pipetted 11 µL of master mix into six tiny plastic PCR tubes, and then I added 4 µL of DNA solution from each mouse into a correspondingly labeled PCR tube. PCR mimics in vivo DNA replication. DNA polymerase is the enzyme that actually copies the DNA; the deoxynucleotides are the monomers that polymerase connects to form the new strands; the DNA primers tell the polymerase where to bind to the DNA templates, which I added next. Pipetting small volumes tends to leave drops stuck on the sides of the tubes, so I pulled all of the liquid down from the tubes’ walls by centrifuging them for two seconds.

I then placed the tubes into a machine called a thermocycler. The thermocycler first heats the DNA to separate the strands, then cools the mixture to allow the primers to attach and polymerase to synthesize a new strand on each extant strand, and then cycles between heating and cooling, doubling the DNA each time. With Jinquan’s instructions, I programmed the thermocycler’s temperature and time settings, then let the reaction run for 35 cycles. Theoretically, the amount of DNA doubles during every cycle, so we should be left with 235 times as much DNA as we started with. This is enough DNA to allow us to visualize it on a gel, which will be the subject of a future post on what it is like to run a DNA gel.

It’s the Scientist that Counts

You’d think that counting things would be easy by now. My first grade class practiced counting these red and yellow chips called “counters” twelve years ago, and I assumed that counting cells would not be so much different.

Counter Pic

Two-Color Counters – EAI Education

Well, counting cells is not so straightforward a process as was passing time with counters in first grade. My purpose in counting was thus: Jinquan—the graduate student with whom I am working—had been growing U2OS cells—a type of bone cancer cell—in six-well plates, and we wanted to measure the number of cells growing in each well to determine wh  ether or not the absence of a certain protein was affecting their growth rates.

In a six-well plate, there are two to three milliliters of medium per well, and each milliliter contained between 100 thousand and one million cells per milliliter—not so easy as counting ten counters. We used a device called a hemocytometer—literally a “blood cell measurer”—and a microscope to count the cells in a very small volume—100 nanoliters—and then multiplied by ten thousand to estimate the number of cells per milliter. It all goes well, unless different samples of the same cells start yielding radically different results, which happened to me.

Hemocytometer

Hemocytometer with a gloved hand – Jeffery Vinocur

There are two different methods I learned to load a hemocytometer. The first is to place a coverslip on top of the smooth platform in the center of the device, creating a 100-micrometer gap between the platform and the coverslip, and then to pipette ten microliters of cells into the grooves, such that the cells are pulled by capillary action into the gap. The second method is to pipette a drop of cells onto each platform, touch a coverslip to the top of each drop, and, keeping the coverslip perfectly level, lower it onto the hemocytometer. The problem was that using the first method, I counted one fifth the number of cells that I counted using the second method. Moreover, my counts disagreed with Jinquan’s. In order to improve my hemocytometer skills, Jinquan emailed me a video on the proper way to use the hemocytometer.

After watching the video, I was still puzzled by the discrepancies between the numbers of cells I counted using the different methods, but I decided that I needed to ask Jinquan about the rules we follow when counting cells in our lab.

For example, when you look at a hemocytometer under the microscope, you see a grid over which many cells are dispersed, count the number of cells in specific millimeter-by-millimeter squares, and then take the average. But what if a cell lies on the boundary between two squares? Jinquan told me to count cell on the left or top boundary but ignore those on the bottom or right boundaries. And what if I can’t tell whether or not something actually is a cell?

Most of the time, distinguishing a cell from a non-cell is easy: cells have thick borders and somewhat resemble glass beads. But distinguishing small cells from non-living specks—which are called artifacts—is not so straightforward. Jinquan told me that if an object looks flat, diffuse, or much smaller than most of the other cells, it is probably an artifact.

Cell Squares

Cells on a hemocytometer – Joseph Elsbernd

Though this guideline helps me pinpoint most artifacts—those three small dots in the top row of the bottom-right-most full square are unequivocally artifacts—but still, there is a threshold of uncertainty on which sit some objects, such as the faint one in the third row and first column of the aforementioned square. Is it a cell? I would count it, because it seems just large enough and its border is well defined, albeit faint, but I am not certain.

On Monday, Jinquan will load U2OS cells into the hemocytometer, and I then will load it using cells from the same tube. She will count them, and then I will count the exact same slide to see if our numbers agree. We will elucidate the cause of the discrepancies between our counts and the internal inconsistencies within my counts and thereby become confident in our data and in my ability to accurately count cells in the future.

A Note or Two on Research

Do you want to work in a research lab? I did as well at the beginning of last semester; actually, I’d wanted to work in a research lab since eleventh grade. I read up on lab techniques in my AP Biology textbook in twelfth grade, and it seemed that performing basic lab work would be neat and simple—you know, just mix this enzyme with this plasmid (a small, circular piece of DNA, often found in bacteria like E. coli), wait 30 minutes, transfect the mixture into bacteria, and let them grow. It also seemed like it would succeed most of the time—I mean, biology is a science, and being a science, it must be able to be repeated, so if one enzyme-DNA reaction works, they should all work. I was completely wrong.

500px-Plasmid_(english)

Plasmid figure posted by Spaully under Creative Commons License. Link.

I’ve made a lot of mistakes, and for those of you who are interested in joining a research lab, I’d like to share with you my mistakes, my failures, and my misconceptions, as well as my successes—don’t misunderstand me, my efforts sometimes work—in hopes that when you join a lab, your understanding of what lab work is like will be superior to my understanding of it back in September, when I joined Dr. Yanming Wang’s gene regulation lab.

So here is one of the first things I learned about research, and it’s probably the most important lesson I learned last semester:

Take notes that are sufficiently detailed, such that, if someone wiped your mind of the work you did, they would tell you how to repeat every single step exactly.

For the first few weeks of looking over the shoulder of one of the grad students in Dr. Wang’s lab, I typed my notes into an Excel spreadsheet, and a typical day’s notes looked like this:

Date Time in Time out Notes
24 Oct 2014 9:10 11:05 Following the protocol for extracting plasmids: centrifuging out E. coli, aspirating the medium,  resuspending the cells, lysing the cells, precipitating out the large components, pipetting off the DNA remaining in solution, putting it in a tube with a DNA-binding matrix, collecting the DNA in the matrix, and eluting the DNA off from the matrix.

Basically, every procedure that one does in the lab is called a protocol. What I was taking notes on were the general steps of the protocol for extracting a plasmid from E. coli. What I should have been taking notes on were the detailed steps:

  • For how long did I centrifuge out the coli, and at what speed?
  • What did I use to aspirate (that means to suck off using a vacuum) the medium?
  • What did I add to the coli to resuspend the cells?

And so on. Now, I hand-write all of my notes on loose-leaf paper, and they look like this:

OLYMPUS DIGITAL CAMERA

The notes above are also for extracting a plasmid, but rather than say, “Resuspending the cells, lysing the cells [that is, breaking open the E. coli cells so that the plasmid DNA we want spills out]” and so on, they read, “Add 250 µL [a µL is a microliter, a millionth of a liter] of Soln. 1 [solution 1], pipette to mix [to resuspend the cells], add 250 µL soln. 2 [to lyse the E. coli cells], invert 6x, wait 3 min,” and so on. Every step in my detailed notes corresponds to one in my cursory notes. The difference is that the cursory notes tell me what the result of each step is, but the detailed notes tell me exactly how to perform, and, if necessary, to repeat each step using solutions 1 and 2 from the plasmid extraction kit.

By taking detailed notes, I can look back at my notes and quickly see exactly what I did on a given day, which helps me quickly resume working and save time. It also lets me detect any mistakes I might have made in the details, which I would not have recorded with my former, cursory note-taking style. And, as taking notes helps me learn the material covered in regular classes, taking notes helps also helps me learn the protocols in the lab. Therefore, once I figured out how to take better notes, I was ready to learn how to perform the most vital tasks in my lab. They will be the subjects of my subsequent posts.