Monthly Archives: April 2015

Ĝ Paper III Part VII: What’s next for Ĝ?

Last time, I described our work on red spirals.  That’s it for the big results in our paper (*whew*!).

So what’s next?

Well, this was a pilot program, to see what was feasible, what a waste heat search is up against.  There are a few future directions to take:

  1. We can try to distinguish natural emission from alien waste heat.  There are many ways to do this.  Two of them, broadly:
    • A false-color image of the mid-infrared emission from the Great Galaxy in Andromeda, as seen by Nasa's WISE space telescope.  The orange color represents emission from the heat of stars forming in the galaxy's spiral arms. The G-HAT team used images such as these to search 100,000 nearby galaxies for unusually large amounts of this mid-infrared emission that might arise from alien civilizations. Image Credit: NASA/JPL-Caltech/WISE Team

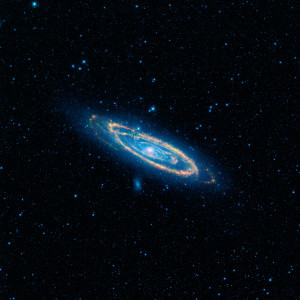
      The Great Galaxy in Andromeda, as seen by WISE. The red, MIR emission is clearly coming from dust in the spiral arms, not the smooth distribution of stars throughout the galaxy.  No obvious K3 here. Image Credit: NASA/JPL-Caltech/WISE Team

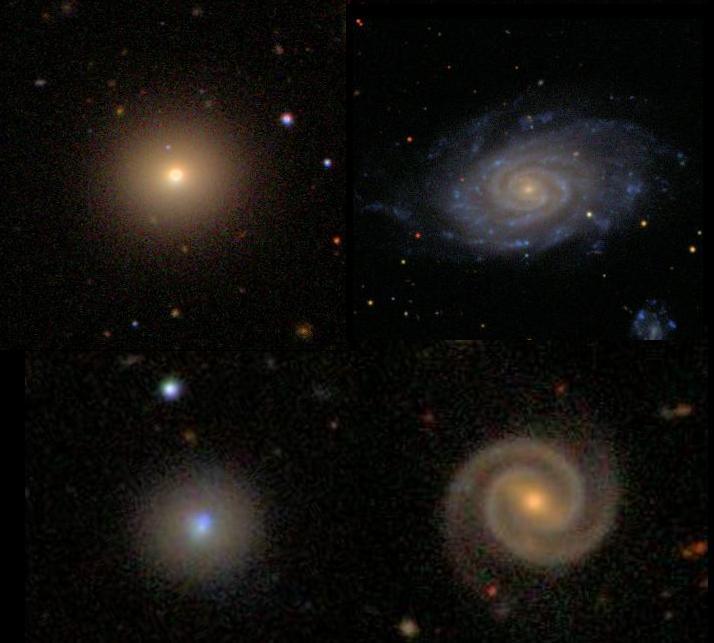
      Look at the morphology. Dust follows gas, which is dissipative; it clumps.  Stars tend to be found in a smooth distribution.  Since the waste heat we are looking for should trace the stars, we can use the morphology of the emission to determine its origin.  An elliptical bright in mid-infrared emission everywhere would be very hard to explain naturally.  If stars in a galaxy are well mixed, the most MIR-faint portion of a galaxy is the best measure of its upper limit on alien waste heat.

    • Loot at the whole spectrum. We can use the entire SED of the galaxy to estimate the mid-infrared emission we expect.  A comprehensive but simple model that accounts for star formation history, AGN, current star formation, and dust composition would have a finite number of free parameters that we could fit an SED to.  This is a more quantitative, sophisticated way of looking for MIR-bright galaxies that have no business being MIR-bright, and can be used on galaxies that WISE does not resolve well.
    Figure from our second paper.  SEDs are for an old elliptical, a typical spiral, and Arp 220, a starburst galaxy. The green and orange curves include the effects of 10% and 35% of the starlight being reprocessed as waste heat.  WISE gets a good handle on the stellar photospheres in the two bluer bands, and the waste heat/dust in the redder bands.

    Figure from our second paper. SEDs are for an old elliptical, a typical spiral, and Arp 220, a starburst galaxy. The green and orange curves include the effects of 10% and 35% of the starlight being reprocessed as waste heat. 

    These approaches will let us push our sensitivity to alien waste heat down from 50-85%, where we are now, to something more like 10-30% for spirals, and down to a few percent for dust-free ellipticals. There’s an order of magnitude improvement in sensitivity waiting to be picked up with just a bit more work.

  2. We can get more quantitative. We just counted galaxies and expressed things in terms of the fraction of starlight consumed, but we can do better. With resolved objects our limits are really best in terms of surface brightness, and so we should be able to combine the above approaches to put limits of galaxies as a function of their stellar mass, and outputs in physical units (erg/s!) and relate things directly to Kardashev’s and Sagan’s scales.
  3. We can look into K2’s—stars in the Milky Way with unnatural MIR excesses.  Right now, this is a difficult exercise because AGB stars, especially carbon stars, and things like obscured AGN show up as MIR-bright point sources, and without a spectrum there is very little to go on to weed them out.  This was the primary difficulty with  Carrigan’s IRAS search, which required painstaking, source-by-source analysis to pick through the AGB stars.But, GAIA is coming, and GAIA will provide parallaxes for anything with an optical counterpart.  So AGB stars and most AGN will have parallax information (that is, small or no measured parallax from GAIA, meaning they’re very distant).  This will allow us to construct a color-magnitude diagram with absolute K magnitude and some color like K-W3.  This is a great way to find debris disks… and that’s about it, because outside of star forming regions nothing else can really mimic a solar-luminosity star with a MIR excess.
  4. Of course, we can follow up our weird no-optical-counterpart cluster, our new apparently-starbursts, and our 5-8 UV-faint red spirals.

We’ve got other ideas, too, but these are the obvious next directions for us to go.

It’s going to be fun!

Ĝ Paper III Part VI: Five Anomalous Red Spirals—Signs of Galactoengineering?

Last time, I discussed the appendix of our paper wherein we examined low- (and no-) surface brightness galaxies, and found that they’re not dim because the stars are all covered in Dyson spheres.

Top: Ellipticals are red, spirals are blue. Bottom: Except when they're not.  The Galaxy Zoo project identified anomalous galaxies, the blue ellipticals (left) and red spirals (right).

Top: Ellipticals are red, spirals are blue.
Bottom: Except when they’re not. The Galaxy Zoo project identified anomalous galaxies, the blue ellipticals (left) and red spirals (right). Credit: Galaxy Zoo blog.

We also looked at galaxies with anomalous populations of stars. The Galaxy Zoo project identified a new class of galaxy — the “red spiral”.  They have optically red colors, like elliptical galaxies, but clearly spiral morphology.  This is strange: spirals usually have lots of blue stars that dominate their light; why do some lack blue stars?

Blue stars are young stars (they don’t live long), so they trace star formation.  Since red spirals aren’t blue, they are sometimes called “passive” spirals, because they are apparently not “active”ly forming stars.

What does this have to do with SETI?  Well, it has been suggested (and if anyone knows a citation, please send it to me!) that galaxy-spanning civilizations would suppress high-mass star formation, because those stars tend to explode as supernovae, and supernovae are bad for the environment.  One might expect, therefore, that a signature of an arbitrarily advanced civilization would be an unnatural “initial mass function” (basically, the number of stars formed at various masses) that lacked any high mass stars.

So, red spirals seem to fit the bill!  Except that there is another explanation for them:  the color of these galaxies also traces star formation history.  If you produced lots and lots of stars in the past, many of them today will be red giants (like in ellipticals) and if you have enough of those, their light could overwhelm the young blue stars.  So red spirals could just be regular spirals that have an unusually large number of red giants, not an unusually small number of young stars.

And indeed, that’s what Luca Cortese found in his study of the near UV emission of red spirals (which traces star formation). The color formed by comparing the near UV to the r-band emission is consistent with other spirals, even if the galaxies look red in the optical.  Red spirals don’t seem to be deficient in star formation (so they’re not “passive”, they’re just red).

Left: near-UV emission (normalized by r-band stellar emission) on the y-axis, midinfared color on the x-axis (tracing dust and, potentially, alien waste heat; right is more dust/heat). Right: same x-axis, but the y-axis traces the W1-W2 color, which should be larger in cases of very warm very luminous amounts of dust/heat.

Left: near-UV emission (normalized by r-band stellar emission) on the y-axis (down is more UV emission), mid-infared color on the x-axis (tracing dust and, potentially, alien waste heat; right is more dust/heat). The horizontal line represents a conservative threshold for “passive” galaxies, which are usually ellipticals or very heavily extinguished (by dust) spirals.  Right: same x-axis, but the y-axis traces the W1-W2 color, which should be larger in cases of very warm or very luminous dust/heat. The green dots are the UV-dim galaxies above the line in the left figure.

BUT… not all of them.  We identified eight red spirals from the Galaxy Zoo sample that have very little near UV emission — so they could be red because they lack blue stars.  What’s more, five of these have very high amounts of MIR emission for spiral galaxies, especially in the W2 and W3 bands compared to W1.  Now, some spirals are edge-on, so their UV emission can blocked by dust in the disk, which could explain the low UV emission.  But we checked and all five of these galaxies are at modest inclination, as far as we can tell.

So… maybe aliens?  Here are “red spirals” that seem to lack star formation, and have high, but not off-the-charts, MIR emission.  That’s weird.  In a sample as big as ours (we checked 5,500 red spirals) there are bound to be a few natural outliers, so we didn’t highlight these in our press release, but we do think they’re worth following up, both as SETI targets and as interesting natural objects.

Next time: Next steps!

Ĝ Paper III Part V: Why are “Dark” and Low Surface Brightness Galaxies Dim?

In the last few posts, I discussed some of the natural sources we found with Ĝ. In this post, I describe some examples of how one could apply the waste-heat approach to “suspicious” galaxies.

In the appendix of our paper, we took a look at two classes of optically anomalous galaxies.  That is, galaxies whose light in visible wavelengths is strange.

The first class are the so-called HI-dark galaxies.  Most galaxies have lots of stars, and so are very bright and obvious.  If you were to enshroud the stars in a galaxy with Dyson spheres, you would lower its surface brightness and it would get darker.  If you completely enshrouded every star in Dyson spheres, it would go totally dark.

In order to create a noticeable decrement in the surface brightness of a galaxy, you would have to cover a lot of the light — around 75% to make it really anomalously faint.  This is the threshold that James Annis used in his trailblazing paper on the topic.  He studied a group of about 100 galaxies all at the same distance, and used the Tully-Fischer relation to determine, from the rotation speeds of the galaxies, how bright their stars should be (their stellar mass content, strictly speaking, then he assumed a mass-to-light ratio).  He then looked for any galaxies that were significantly dimmer than this value.  He found none that would be consistent with 75% coverage by Dyson spheres, similar to our limits from Ĝ.

There is also a whole class of galaxy called a low surface-brightness galaxy (LSB).  These are often very hard to detect because they are so dim.  In principle, these could be examples of the galaxies Annis was looking for.

Of course, if the stars were completely covered with Dyson spheres, the galaxy wouldn’t be dim, it would be black.  But then, you wouldn’t know where to look for them in the first place.  Except, that galaxies don’t just contain stars, they also contain gas, like neutral hydrogen, and such gas can be detected with radio telescopes.

3-colour image of VIRGOHI 21 from the Isaac Newton Telescope

VirgoHI21: a dark galaxy.  “A three-colour (i, r, and B bands) image of VIRGOHI 21 from the Isaac Newton Telescope overlaid with contours of neutral hydrogen density (green) from observations with the Westerbork Synthesis Radio Telescope.” Original image here. Credit Robert Minchin for figure and caption.

Radio surveys have discovered many galaxies by searching for their neutral hydrogen emission, including many in the Virgo galaxy cluster.  But a few of these galaxies are very strange: they don’t seem to have any stars at all!  This is weird, but not impossible: we don’t know why these galaxies don’t seem to have formed any stars with their gas, but there are ideas.  These are called HI “dark” galaxies (HI = “aitch one” = hydrogen in its first ionization state).

But are they Type III Kardashev civilizations?

We went and studied 100,000 galaxies for emission, and if any of the LSB’s or dark galaxies were really dim because alien civilizations were blocking 99% of their starlight, they would have stood out as the very reddest objects in our survey.  Indeed, we didn’t search only known galaxies, but we searched every extended object that was bright in the W3 band, exactly so that we wouldn’t be biased against optically faint galaxies like these.

But just to be sure, in the appendix we specifically targeted a bunch of HI dark galaxies from the literature, and made sure to break out the LSB’s (as identified by SIMBAD) in our search.

We found… nothing among the HI dark galaxies.  No mid-infrared emission.  It turns out we weren’t the first to look, but we were probably the first to look in a SETI context.  So the HI dark galaxies are still strange, but they’re not K3’s.

Figure 11 from our paper. The Low surface brightness galaxies (LSBs) are the blue stars in the upper right panel. They seem to be typical of ordinary galaxies (black points, upper left), and perhaps star-forming galaxies (black points, upper right). Galaxy classifications from SIMBAD.

Figure 11 from our paper. The Low surface brightness galaxies (LSBs) are the blue stars in the upper right panel. They seem to be typical of ordinary galaxies (black points, upper left), and perhaps star-forming galaxies (black points, upper right). Galaxy classifications from SIMBAD.

The LSB’s , it turns out, aren’t especially bright in mid-infrared colors, and they are, indeed, dimmer than typical galaxies, on average. No surprises here: they’re just low on stars.

Next week: Red spirals!

Ĝ Paper III Part IV: Wherein We Sort of Find What We Were Looking For

Last time I discussed our discovery of the MIR nebula surrounding 48 Librae.

We also discovered another weird set of point sources.  Our formal search was for extended objects, but these appeared to be a single extended object in our initial cuts because they are so close together.  Also, the blending messed up our initial round of photometry, making them look redder than they really are.

So we really should have just tossed them, but they’re really strange objects for being so high above the Galactic plane (b=+11), and we kind of got caught up in figuring out what they are.

OK, so what am I writing about?  These things:

Mystery sources.  Red=W4=22 micron emission.  Those are red objects!

Mystery sources. Red=W4=22 micron emission, blue=W1+W2, green=W3. Those are some really red objects!

A cluster of 24-micron bright, red point sources.  No big deal, right?  But check out that same patch of sky in the optical:

Mystery sources in optical (B band) light. Nothing! Black sky!

Mystery sources in optical (B band) light. Nothing! Black sky!

Eric Mamajek. Chalkboard mathy guy, and frequent appearer on this blog.

Eric Mamajek. Chalkboard mathy guy FEPS team member, and now apparently a frequent appearer on this blog.

Nothing!  Totally black.  This is the expected signature of a cluster of Dyson spheres (which is not to say that a cluster of Dyson spheres is expected!).  What are these things?  We have a few more clues.  The first is that there is serendipitous MIPS imagery.  The FEPS survey (whose researchers include one of the AstroWright blog’s favorite chalkboard-mathy guys, Eric Mamajek) observed a bunch of young stars with Spitzer.  One of those stars just happened to be at just the right angle when IRAC was looking at it to have the MIPS camera just happen to land on our mystery objects!  Talk about luck.  Anyway, Spitzer/MIPS saw this:

Serendipitous Spitzer MIPS imagery of our mystery cluster.

Serendipitous Spitzer MIPS imagery of our mystery cluster.

So there is a lot of structure in there—many sources, including 4 that are labelled, at least three in that bright cluster to the upper right (NE), and maybe many more very faint ones all over the place.

So do we win? Are these Dyson spheres? Well, take a look at that bright NE cluster in the near-infrared (from 2MASS):

2MASS imagery of our mystery cluster

2MASS imagery of our mystery cluster. (Note that we’ve zoomed way in here on the bright cluster of sources).

You don’t expect room-temperature Dyson spheres to have emission at 1 micron (J-band) — they would have to be over 1000K for that.  This looks more like extinction than low temperature.

That is, dust blocks the blue light and transmits the MIR very well, with the NIR in between.  That’s what we see: lots from WISE, a bit from 2MASS, nothing from the visible.  If this were thermal emission there would be a much sharper falloff (exponential!) in emission from the WISE to 2MASS bands — 2MASS shouldn’t have seen anything.  Instead, we see a much slower decline towards the blue.

In other words, whatever is blocking the starlight is not totally opaque to NIR emission.  So, not a bunch of solar panels; more likely a lot of dust.  We thought about cosmology, but it’s hard to imagine a scenario that gives us multiple, IR-bright but optically invisible galaxies in a small patch of sky like this.  That means this is probably an embedded cluster of forming stars in the Milky Way.

There is a CO detection in this direction, which supports this conclusion, but the catalog entry is confusing (it looks like it’s been transposed with another entry in Yang et al. (2002)). If the velocity of the CO is correct, then the cluster is at about 850 pc away.  At b=+11, that puts it 170 above the Sun’s position in the Galactic plane, which is pretty high for a molecular cloud.

Anyway, there’s basically nothing in the literature about these things.  It’s not surprising that we would find a previously uncatalogued molecular cloud with embedded YSOs (or something) inside in our search, especially a small one so far away, so that’s probably what it is.

But still, we can’t be sure yet. What we really need is a spectrum.

So… if you’re an IR astronomer reading this, and you have a few spare minutes on a Northern Fall night with a spectrograph, do me a favor and grab me an H-band (or any band!) spectrum of WISE J043329.55+645106.5?  Let me know if they’re some kind of young star.

And if the spectrum looks featureless or otherwise inexplicable…call me right away!

Next time: Back to the SETI targets!

Ĝ Paper III Part III: What’s the Deal with 48 Librae?!

Last time I blogged about our bottom line on Kardashev Type III civilizations.  This time: science of natural sources.

One of the nice things about a search like the one we’re doing is that because we are exploring a new parameter space with a new instrument with orders of magnitude better sensitivity than previous instruments, we’re going to find some strange new things.

First, we found some MIR-bright galaxies that no one had ever noticed before.  They have almost no presence in the literature at all, despite having some of the most extreme MIR colors of any galaxies in the sky.  They are most likely nearby starbursts of various flavors, but until we check more carefully we can’t be sure.

Next, we found a huge nebula around the classical Be shell star 48 Librae.  Now, 48 Librae is very bright, and so is very well known among a certain class of stellar astronomer.  It is a Main Sequence B star (so very hot and massive) that exhibits very low surface gravity features because it is very rapidly rotating — nearly at breakup speeds.  This gives it a highly oblate shape, with the material at the equator nearly flying off.  Indeed, the star is rotating so quickly that it has an excretion disk.  This disk has material that is occasionally seen in absorption as it moves away from the star (the “shells”) and shines brightly in some emission lines (the “e” in “Be”).

48 Librae is known from the IRAS survey to have a midinfrared excess, but that’s not too unusual, since these stars’ excretion disks can have a lot of warm material shining in the MIR.  What is unusual is that the source isn’t the disk, it’s an enormous nebula around it:

22 micron emission around the Be shell star 48 Librae.  I drew the arcs in by hand.

The 22 micron Nebula around the Be shell star 48 Librae.

Eric Mamajek. Chalkboard mathy guy and Facebook scientist.

Eric Mamajek. Chalkboard mathy guy and Facebook scientist.

What’s going on?  To find out, I consulted some astronomers.  Mostly by email, but one, in particular, I consulted over Facebook.  Regular readers know that Eric Mamajek helped us figure out the coordinates of the CTIO 1.5m, and taught us astronomers a lot of about the various coordinate systems used to describe the location of things on the Earth.  Eric, true to form, responded to my request to figure out what sort of star 48 Librae is with a lengthy dive into the literature.

So I had to figure out how to cite him, of course.  Fortunately, Facebook has unique URLs for every post, and since my posts are public, that URL serves to point to Eric’s research.  Here’s how the citation looks in the paper:

How to cite a Facebook post

How to cite a Facebook post

(AAS journals have a “no URLs” rule in the body (and bibliography, I think), but anything goes in the footnotes, so there it goes).

Anyway, we thought at first it must be a reflection nebula.  Lots of B stars, like those in the Pleiades, illuminate the dust around them.  Paul Kalas has a nice paper describing the “Pleiades phenomenon” they discovered around many hot stars in their search for substellar companions with adaptive optics.

In the Pleiades, this dust scatters the blue light of the stars very well, and the hard radiation from these stars both heats and excites the dust, causing it to give of thermal radiation, and the PAHs in the dust fluoresce in the WISE bands (especially W2 and W3).

The problems with this interpretation for 48 Librae are:

  • There’s no blue scattered light here.  OK, whatever, maybe you just need more dust to do that?
  • There’s no W2 emission, and hardly any W3.  OK, so not much PAH emission, maybe there aren’t many PAHs in the dust?
  • The nebula doesn’t look like a randomly illuminated patch of dust. There are arc structures in it.  I fit the arcs by eye to a series of nested ellipses centered on the star, and found that they roughly match up:
22 micron emission around the Be shell star 48 Librae.  I drew the arcs in by hand.

I fit the ellipses in by hand using Keynote. They are concentric, centered on the star.

OK, so maybe it’s not illuminated by the star?  The other way to get these nebula is with a bow shock: the star moves faster through the gas than the local sound speed, and shocks it.  The shock heats the gas, which then glows.  The problem here is that 48 Librae isn’t moving very fast. It’s proper motion is quite small, in fact almost entirely due to the Sun’s motion through the Galaxy.  Plus, the nebula doesn’t really look like a bow shock.

So I wondered whether the nebula could be from 48 Librae itself?  The basic physics makes sense:  Be shell stars have excretion disks, and they are known to have winds that carry away material (we see the narrow, blueshifted metal lines in the spectra).  At some distance, this material becomes cool enough to condense into solids (like soot condenses in a flame, I’ve learned from Eric Feigelson). If this happens when the material is still at a sufficiently high density, it will form dust.

This explanation would explain the symmetries of the arcs in the nebula, and provide a mechanism for their emission.  The arcs are centered on the star because they are rings of ejected material, and they might be bright because they have been shocked during collisions either with previously ejected material, or the surrounding ISM.  They dust graints might also might have a size distribution that makes them fluoresce under the light of 48 Librae, but be inefficient at scattering the blue light that makes a reflection nebula.

If this is right, then we would expect the orientation of the ellipses I’ve drawn to correspond to the excretion disk.  I had email consultations with a bunch of Be star experts, including Stan Owocki and Thomas Rivinius, and they pointed me to some of the basics.  Since the disk is seen in absorption, it must be inclined no more than ~25 degrees from edge on, and my ellipses are inclined 20 degrees from edge on.  The actual position angle is known from interferometry to be 50±9 degrees from Štefl et al. 2012, consistent with our rings at 1–2σ, or within the rough precision with which we can define them.  Also, the nebula is not too big to be from the star: at the shell expansion velocity it would only take 30,000 years or so to get that big.

So it all checks out: the arcs are about right to be extensions of the excretion disk.  If this is correct (and I consider it a longshot) then Be stars could be important sites of dust formation, and we should reconsider some of the “Pleiades phenomena” as being something other than a coincidental pairing of stars and dust.

What fun!

Next time: a mysterious cluster of IR sources with no optical counterparts!

Ĝ Paper III Part II: Our First Limits on Type III Kardashev Civilizations

Last time I gave the background for our third paper, which is now up on the arXiv here.

So what did we find?

We were looking for so-called Type III Kardashev civilizations, galaxy-spanning civilizations that command power equal to all of the stars in their galaxy.  A true Type III civilization would be blocking a significant fraction of all of a galaxy’s starlight from leaving the galaxy, and harnessing it for its own purposes.  Such a galaxy would be very faint in optical light — from all of the solar panels collecting the starlight — but very bright in the mid-infrared, where all of that energy would have to come out when the civilization was done using it.

Looking through the WISE catalog, Roger found that zero galaxies were consistent with more than 85% starlight reprocessing by alien industry.  This is our first-order upper limit: there are no galaxy-spanning civilizations in galaxies resolved by WISE with aliens using more than 85% of their starlight.  This mostly rules out Type III civilizations as Kardashev originally defined them, because they were a sort of maximal case.

We found 50 galaxies (out of 100,000 galaxies surveyed) were consistent with more than 50% starlight reprocessing.  Jessica found that most of these have a heavy literature presence, which is not surprising, since they have such extreme MIR emission.  They are mostly starbursts; indeed one of the reddest objects we list in our catalog is Arp 220, the quintessential local starburst.  We know why they have a lot of MIR emission — the morphology of these galaxies makes it obvious that the emission is from dust illuminated by star formation regions.  Once we have gone through all 50 of these galaxies and confirmed the natural origin of their excessive amounts of MIR emission, then our upper limit in Type III civilizations will be around 50%.

We also identified around 90 galaxies consistent with more than 25% reprocessing that have very little literature presence.  These are more interesting from a SETI perspective, because it’s possible that they are NOT starbursts (that is, without a lot of study, no one would have noticed anything anomalous about them).

Now, you might be thinking, 85% is a pretty weak upper limit.  All those galaxies might be filled with alien civilizations using enormous amounts of power, but just be lost in the glare of all of those stars and dust in the galaxy.  But weak upper limits are how all sensitive experiments begin.  Raymond Davis (who won the Nobel Prize for detecting cosmic neutrinos) quoted the referee of his first paper on neutrino detection, a very weak upper limit in 1955:

Any experiment such as this, which does not have the requisite sensitivity, really has no bearing on the question of the existence of neutrinos. To illustrate my point, one would not write a scientific paper describing an experiment in which an experimenter stood on a mountain and reached for the moon, and concluded that the moon was more than eight feet from the top of the mountain.

Well, one might if one had no idea how high the Moon was! Indeed, I’m sure our ancient forebears asked as much of the first explorers to return from the highest mountaintops.  The idea only seems absurd to us today because we know the answer.  In 1955 people thought they knew what sorts of cosmic neutrino fluxes to expect — but one must always be prepared to be surprised!

So, OUR fist upper limit is 85% of a galaxy’s stellar luminosity, and with some work we can get down to 50%.  What’s next?

We can still look for Type “2.9” (on Sagan’s scale).

Fig.6

Arp 220, the quintessential local starburst galaxy, as seen by WISE. This galaxy came up very high on our list of galaxies with too much waste heat. As expected, starbursts such as this are our primary confounder. No alien civilization in the local universe uses so much of its starlight’s energy that it has as much 22 micron emission as Arp 220. That’s a new result! Now we know.

We can actually model the SEDs of these galaxies.  Star formation and dust emission have many tracers, and there are relationships among luminosities at different wavelengths for the many components that make up a galaxy.  By combining optical, NIR, MIR, and radio observations of galaxies, we can ask: which galaxies have MIR excesses given the rest of their SEDs.  That will get us even lower.

But we can do much better.  Elliptical galaxies have very little MIR luminosity.  This means they have a low “natural background” for us to search in.  We can get down to a few percent by looking at dust-free elliptical galaxies.

But we can do even better.  Because WISE resolves galaxies, we can see if the midinfrared emission traces the stars!  The stars in an elliptical should be well mixed, so the civilizations harvesting their energy should be well mixed, and the MIR emission should trace the starlight.  MIR emission concentrated in the center is a giveaway that it’s from dust.

Next time: Strange new (non-alien) objects in WISE!

Ĝ Paper III Part I: Searching the WISE catalogs for Type III Kardashev Civilizations

It’s been a while since I’ve blogged about our Ĝ project, and since we have a press release coming out soon, it seems like a good time to start again.

University of Toledo professor Michael Cushing, classifier of Y dwarfs. Coincidentally, we were undergraduates together at Boston University, where we both did research with Dan Clemens.

We have our first results coming out in a paper published in ApJS soon; until then here’s the background. This paper is the result of a lot of hard work by our post-baccalaureate Roger Griffith.  Roger comes to us from the WISE team that discovered the first spectrally-classified Y dwarfs; in fact it was a talk by Michael Cushing on that team at Penn State that first gave me the idea to use WISE to do this (since Y dwarfs are at about room temperature!).

Roger came with ready knowledge about how to interrogate not just the WISE All-sky catalog, but also the lower level data that we used to reject artifacts and comets and other false positives.  He also had code all set up to make “at-a-glance” charts of all of our most interesting sources, and in the end he personally inspected something like 100,000 images!  The paper is long, a testament to his hard work.

Post-baccalaureate researcher Roger Griffith. Roger is lead author on our latest paper.

We decided to start with the red extended sources in WISE that appear outside the Galactic Plane.  Our rationale was that there are lots of reasons an object might appear “red” (i.e., to have a lot of 12 or 22 micron emission).  If all you have to go on is a point of light in the sky and broad-band photometry, there’s not much one can do to diagnose the origins.  But if the source is resolved, then you have some information, and the number of false positives goes way down.

We discovered that when you go looking for extreme objects, all of the rare special cases in the data reduction come flooding into your lists.  The WISE team did a great job of removing artifacts, solar system objects, and other things we weren’t interested in from the list, but when you have 100,000,000 sources, there are always going to be a few that sneak through.  We discovered lots of things that looked a lot like what we were looking for at first glance, but turned out to be reflections from bright stars, latency in the infrared detector array, nebulosity in the Milky Way, and similar artifacts.  Roger had his work cut out for him sorting through all of this stuff, and his work on that constitutes much of his paper.

Tom Jarrett, builder of atlases and photometrist of extended sources.

Tom Jarrett, builder of atlases and photometrist of extended sources.

Another major complication is that the WISE photometry pipeline was not designed to do great photometry on extended sources.  It’s an automated routine, and extended objects tend to need human intervention to get the details right.  We found that there were systematics in the All-sky photometry for most extended sources.  Fortunately, Tom Jarrett has been working on a WISE atlas of extended sources with careful photometry.  He graciously lent us a preliminary version of his catalog for the South Galactic Cap.  We found a good coefficients to a nonlinear combination of All-sky photometry from different apertures, and this allowed us to calibrate the existing WISE photometry to these sources.

Cal Poly Pomona undergraduate Jessica Maldonado, searcher of literature.

After we had made our list, we needed to know what these things were.  Roger cross-matched to NED and SIMBAD, but we still needed someone to hunt down each and every object in the literature and see what it was.  That’s where Jessica Maldonado came in.  Jessica is an undergraduate at Cal Poly Pomona working with Matthew Povich, and she did the yeoman’s work of lots and lots and lots of literature searches for hundreds of our best candidates.

So why would we conduct a search for alien waste heat using resolved sources? Because a galaxy containing a Kardashev Type III civilization is pandemic with intelligent, spacefaring life.  The total energy use of this supercivilization would, unless they were using most of it to send out lasers or create matter or something, have to come out at roughly mid-infrared wavelengths.  The entire galaxy would have a bit too much 12 or 22 micron emission.  If the civilization’s energy output were greater than a few % of the starlight in the galaxy, then this would be easily detectable with WISE as a diffuse MIR excess across the whole galaxy.  We discuss all of this in our first two papers (here and here).

Of course, galaxies have lots of mid-infrared light for many other reasons, too, mostly having to do with dust.  But a typical elliptical galaxy, for instance, has so little dust that even a  few % excess would be obvious.  We found that any civilization preprocessing more than about 10% of the starlight in the galaxy would be anomalously bright — even if the galaxy were a spiral.  So we set out to find what the upper limit was.  After all, no one has done this before, so it was in principle possible, though unlikely, that there was a galaxy with a civilization using most of its starlight right in our own backyard!

Also, we don’t know what energy sources an alien civilization might use.  We tried to think hard about this in our first paper, but for all we know it’s possible to tap zero point energy or generate Romulan warp core singularities or who-knows-what, so in principle an alien civilization could have an energy supply that is 110%, 200% or 1,000% of the starlight in its galaxy.  Has it ever happened?  If it has, WISE would see it.

Figure from our second paper.  SEDs are for an old elliptical, a typical spiral, and Arp 220, a starburst galaxy. The green and orange curves include the effects of 10% and 35% of the starlight being reprocessed as waste heat.  WISE gets a good handle on the stellar photospheres in the two bluer bands, and the waste heat/dust in the redder bands.

Figure from our second paper. SEDs are for an old elliptical, a typical spiral, and Arp 220, a starburst galaxy. The green and orange curves include the effects of 10% and 35% of the starlight being reprocessed as waste heat. WISE gets a good handle on the stellar photospheres in the two bluer bands, and the waste heat/dust in the redder bands.

We used the shorter, W1 and W2 (3-5 micron) bands to get a handle on the stellar photospheres in the galaxies we searched, and the W3 and W4 (8-26 micron) bands to measure the waste heat.  We started by assuming that all of the heat was coming from alien civilizations (that is, that the galaxy had no dust) and calculated the fraction of starlight that would have to be reprocessed to explain it.  We also allowed the waste heat temperature to float as a free parameter.  We then sorted all of the WISE galaxies by this starlight-covering fraction. This gave us upper limits on the amount of alien waste heat that could be in each of our 100,000 galaxies.

Next time:  The results of our survey.