Category Archives: 3rd Post 2019

Transition state search for reaction from AA to AB stacked bilayer graphene.

Lev Krainov

Introduction

In the previous post[6] we found AA and AB locally stable configurations of bilayer graphene and their energies. It is well known that AB bilayer graphene is lower in energy and AA stacked bilayer transforms into it. Such a transition has to have  a transition state which is the focus of this study.

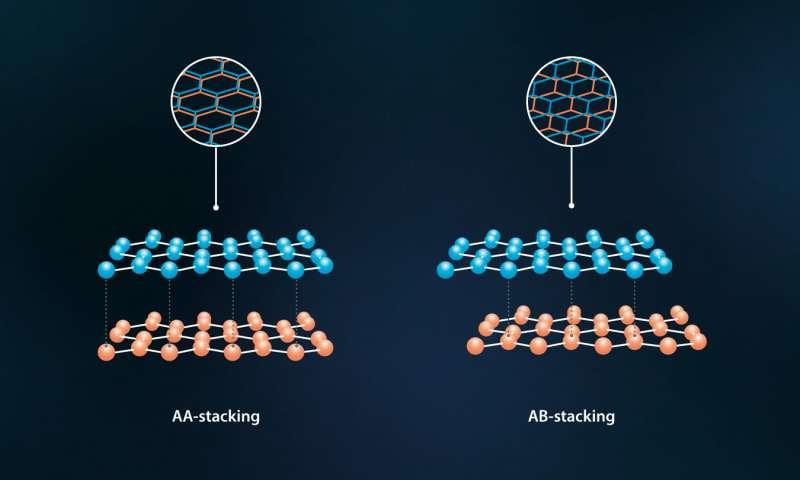
Figure 1. Bilayer graphene. AA and AB stacking. (Source [5])

For AA stacked bilayer the atoms are right on top of each other. For AB stacked bilayer A subltattice of top layer is on top of B subltattice of the bottom layer and B sublattice of the top layer is hovering over the center of honeycombs of the bottom layer. One way to represent this reaction is to shift the whole top layer by one bond length. This choice of transformation is explained by a strong intralayer and weak interlayer interaction in bilayer graphene. In order to avoid atoms crossing periodic boundary of a unit cell a slightly modified unit cell was introduced for AB stacked bilayer graphene(Fig 2).

Figure 2. Top(blue atoms) and bottom(orange) layers of reactant(left, AA stacking) and product(right side, AB stacking) used in calculations. Such choice avoids trajectories crossing or touching boundary of the unit cell. The unit cell is marked by a parallelogram.

Computational details

Ground state energy computations were performed using DFT plane-wave pseudopotential method implemented in CASTEP[2]. With CASTEP, we use the GGA-PBE as an exchange-correlation functional [3]. We also employ On-the-fly generated (OTFG) ultrasoft pseudopotential was used to describe the interactions of ionic core and valance electrons with a core radius of 1.4Bohr(0.74 Å) [4]. Pseudo atomic calculation is performed for 2s2 2p2 orbitals of C atoms. SCF convergence tolerance was set to 5.0E-7eV/atom. Since plane-wave method requires periodic boundary conditions we make a box of height h=17 Å and a cross section matching unit cell of graphene(a=2.46 Å).

To account for interlayer van der Waals(vdW) interaction we used Tkatchenko-Scheffler DFT-D correction[1].


Transition state search algorithm

To find transition state we employ Linear and Quadratic Synchronous Transit methods(LST/QST)[7]. The reactant and the product have to be geometrically optimized, which was done previously[6]. The parameters used for optimization were ECUT=650eV and KPOINTS=17x17x1.

The LST/QST algorithm requires one-to-one matching of product and reactant atoms. The bottom layer is trivial, but the top layer could be matched in at least two different ways. We chose matching pattern corresponding to shifting top layer as a whole, as mentioned above.

The algorithm starts with LST, followed by conjugate gradient minimization. The obtained approximation to the transition state is then used as an intermediate state for QST. The result of QST maximization is again refined by conjugate gradient minimization(CG). Then QST and CG steps are repeated until the RMS force is within 0.1eV/A. To speed up the computations we used ECUT=500eV and KPOINTS=11x11x1, providing convergence of energy up to 0.005eV.

Results

Before the transition state search both AA and AB stacked bilayers were geometrically optimized using the same ECUT and KPOINTS. The reaction energy 13meV/atom was consistent with the binding energy differences obtained previously in the studies using the same method for vdW interaction[6, 8].

The results of LST/QST search are shown on Fig 3. The search fails at LST stage because AA stacking energy is the highest on path constructed by LST.

Figure 3. Transition state search from AB(x=0) to AA(x=1).

One of the possible reasons could be that transition state is too close to AA and LST simply jumps over it. In order to check that statement we constructed our own linear path according to

x_i(p) = (1-p)x_i^{AB} + px_i^{AA}

where p is a path coordinate ranging from 0 to 1 and x_i is a position of i-th atom. This path shifts layers as a whole while changing distance linearly. Such transformation allows to keep intralayer bonds optimized. If there is a transition state between AA and AB, there should be a point on this path with energy higher than AA configuration. According to Fig. 3 such point would be close to AA configuration. Finally, to make sure we’re not missing a shallow maximum we increased ECUT and KPOINTS to 700eV and 19x19x1, respectively. This converges energy up to approximately 2E-4eV within our numerical model. Energy E(p) is shown on Figure 4.

Figure 4. Energy along our constructed path [latex]x_i(p)[/latex] adjusted by the energy of AA configuration. Line shows a second order polynomial fit.


Conclusion

Figure 4 suggests that AA stacked bilayer graphene is not a local maximum, but could be transition state itself, since the RMS force at AA state was 2.5meV/A. One possible scenario is that AA state is a transition state between two AB states with relative shift by a primitive unit vector. Another possible explanation is that error due to our choice of system size, pseudopotential and vdW correction does not capture shallow local minimum at AA state.

Bibliography

[1]  A. Tkatchenko, M. Scheffler, “Accurate molecular van der Waals interactions from ground-state electron density and free-atom reference data”, Phys. Rev. Lett. 102, 073005 (2009).

[2] S. J. Clark, M. D. Segall, C. J. Pickard, P. J. Hasnip, M. J. Probert, K. Refson, M. C. Payne, “First principles methods using CASTEP”, Zeitschrift fuer Kristallographie 220(5-6) pp. 567-570 (2005)

[3] Perdew, J. P; Burke, K; Ernzerhof, M. Phys. Rev. Lett. 1996, 77, 3865-3868

[4] CASTEP GUIDE, BIOVIA, UK, 2014. URL : http://www.tcm.phy.cam.ac.uk/castep/documentation/WebHelp/content/pdfs/castep.htm

[5] https://phys.org/news/2017-01-scientists-bilayer-graphene.html

[6] https://sites.psu.edu/dftap/2019/03/29/investigation-of-interlayer-distance-for-aa-and-ab-stacked-bilayer-graphene/

[7] Halgren, T. A.; Lipscomb, W. N. Chem. Phys. Lett., 49, 225 (1977).

[8] I. V. Lebedeva, A. A. Knizhnik, A. M. Popov, Y. E. Lozovik,and B. V. Potapkin,Phys. Chem. Chem. Phys.13, 5687(2011)

Diffusion Pathways for Platinum Adatoms on a Platinum Surface

By Charles Bigelow

Abstract

Analysis of two possible methods of diffusion of platinum  on a platinum metal surface in the forfold site. The initial and final conditions were optimized and both the hopping and the substitution pathways were analyzed. It was discovered that the hopping mechanism between forfold sites was more energetically favorable than the concerted substitution between the adatom and a surface platinum.


Introduction

     Propagation of adsorbed atoms on a metal surface is a chemical phenomena which is of great significance to surface chemistry. Knowledge of this diffusion helps the scientific community to design better catalysts, substrates, and give a better understanding of the underlying mechanics and reaction pathways of a given process.

Metals, in particular, have various ways of migrating across a metallic surface. This is achieved through hopping between different sites on the metal, or through substitution with an atom in the crystal structure itself. These pathways will be analyzed to observe their barrier energy, which will indicate which process is more energetically favorable under normal conditions. This information can be used to help aid in designing pathways for a new catalyst to be produced, as well as to observe how likely catalyst poisoning may occur through substitution.

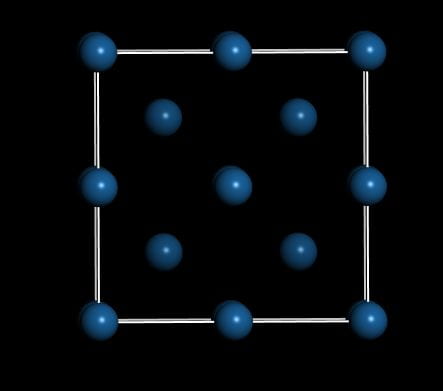
Figure 1: Platinum Surface with adatom (Top)

Figure 2: Platinum Surface with adatom (side)

Method

Figure 3: 1.5 Layer Slab

     A 1.5 layer slab of platinum was generated by cleaving the surface of a bulk sample of platinum along its 100 miller plane. The size of the unit cell was doubled to minimize errors due to periodic boundary conditions; normally the lattice would be tested at various unit cell sizes, however due to computational limitations a larger surface area would not be feasible for the given machine.

A vacuum slab of 13 angstroms was used to ensure that the adatom would not have interactions with the slab above; this is an increase from previous vacuums used earlier in the semester. After generation of the surface, the adatom was generated on the slab at one of the fourfold sites, and its distance optimized from the surface of the lattice manually to save on computational cost. The adatom’s optimal distance from the surface was calculated to be 3.9 angstroms. This was accomplished by varying the distance of the adatom from the surface in the z direction and taking the derivative of the resulting polynomial equation.

An initial and a final slab were generated by moving the adatom to an adjacent site on the platinum surface and placing at the optimal distance. A reaction pathway was generated and 5 steps between initial and final were used to calculate the activation energy. The LDA PWC functional was used to run the calculation using a DND basis set and a basis file of 3.5 [1].

The concerted substitution was done similarly, the only difference was that the initial adatom was associated with the final center lattice atom, and the final adatom associated with the initial center lattice atom. Smearing of 0.005 hartree was implemented for the electron transition of the adatom substitution to remove the discontinuity of the calculation; the hopping mechanism did not require any smearing to run to completion [2].


Results

     The most optimal distance was found to be at 3.965 angstroms above the fourfold site, which achieved the lowest equilibrium energy for both the initial and final structures.


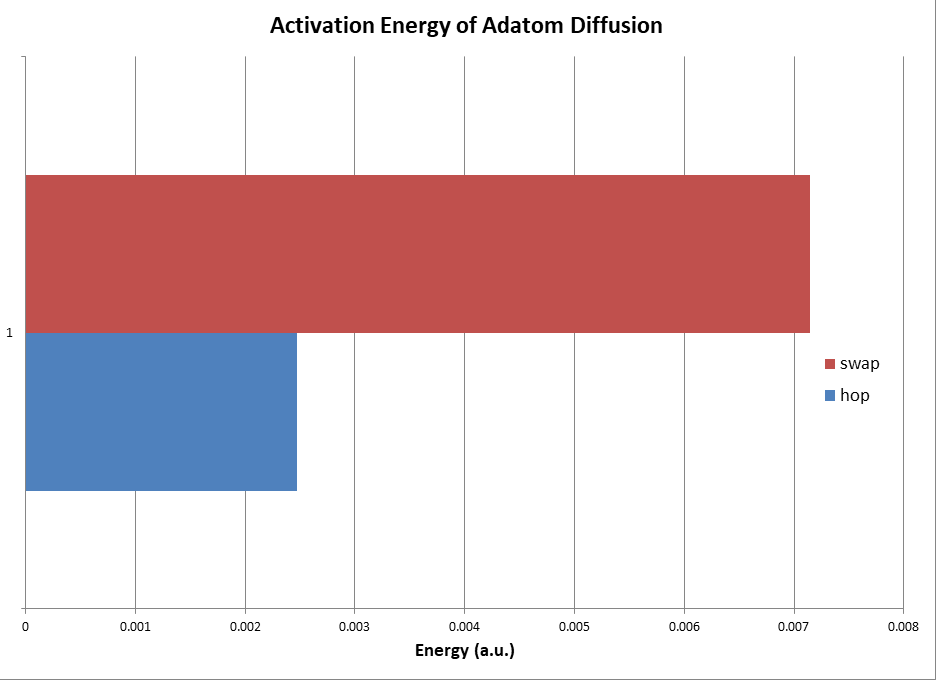
When the two methods of diffusion were analyzed, it was discovered that the hopping substitution had an activation energy of 0.002471 hartree, while the substitution was at 0.007148 hartree.

Conclusion

The hopping mechanism was the lowest energy process in terms of diffusion across the surface of the metal surface,  indicating it is the primary method of movement for adatoms on the surface. The substitution method was over double the required activation energy compared to diffusion via hopping; this indicates that this is less likely to occur at a given temperature, however, the energy difference was small enough to allow adatom substitution at a notable rate over time, indicating that the surface would have atoms replaced over an extended time frame. This mechanism is observed in various cases of catalyst poisoning, contributing to the difficulty of effective catalyst design.


URL References

  1. http://nees.sci.upc.edu.cn/_upload/article/files/39/f5/5460e8894554bd75148145ba414e/188a6221-e993-431c-bf9e-28e3051fd772.pdf
  2. http://nees.sci.upc.edu.cn/_upload/article/files/39/f5/5460e8894554bd75148145ba414e/188a6221-e993-431c-bf9e-28e3051fd772.pdf

Possible transition processes of Pt adatom on Pt(100) surface

by Hepeng Ye

Introduction:

Surface diffusion is a common process for solid materials, and in our case, the Pt adatom could diffuse along the surface of Pt(100). Diffusion is governed by the thermal energy from the environment and the property of such behavior is important for understanding surface phase formation, heterogeneous catalysis and other aspects.

In our case, Pt adatom is hypothesized to undergo a hopping between two adjacent four-fold sites or undergoes concerted substitution. To study the process, a model needs to be built and in our case the model is fairly simple since neither diffusion process has linear interpolation issue, and as consequence, one just need an initial and final two-state model for the transition state study. By connecting the initial and final state of the system, one could locate the TS (transition state) of that process and use the energy barrier from the transition search to further study the kinetic of process.

Experimental:

First cleave the Pt(100) lattice, and create the slab and a five-layer slab of 2X2 super-cell with 5Å vacuum space was set as the starting point. As mentioned the goal of the experiment is to identify the more likely transition process from the two, and in order to get reasonable comparison between the two processes, one need to first optimized the system(slab) to make sure that the super-cell is large enough for boundary conditions and enough vacuum space to prevent interaction from the next periodic slab along the Z-axis. Layers of the slab will not be optimized due to time limit, and based upon experience, five layers should be enough.

For vacuum space optimization, build three slabs with 5Å, 10Å and 15Å vacuum space, and calculate energy with CASTEP, functional used is GGA PBE, pseudo-potential is OTFG-ultrasoft, and all other parameters are set to default (272.1eV energy cutoff, 6x6x1 K-points, core radii is 1.27A with electron configuration to be 5s2 5p6 5d9 and 6s1).

Figure 1. Example of the slab used for vacuum space optimization. (5layer, with 10A vacuum)

Use the lowest energy vacuum space to continue slab size optimization.

To do this, one will first identify the most stable height of the Pt adatom on the surface. Sitting on top of the fourfold site, it is obvious that the adatom cannot be either too close or too far from the surface where too close to each other there will be repulsion and too far to each other will make Pt adatom isolated from the surface and could interact with the next periodic slab. Consider the short range dispersion, there should be a local energy minimum for the Pt to sit on top of the surface and bring down the system’s energy. So the height is tuned manually by putting the adatom between 1Å to 3Å above the center of the four-fold site.

When Pt adatom transit from one four-fold site to another, the energy for it being reactant should be the same as it being the product. Using this idea, I will separately calculate the energy for Pt adatom sitting at different fourfold sites, for different size of slabs.

The lowest energy height optimized previously will be used, and start with 3×3 super-cell.

Figure 2. Position of initial and final state of fourfold site.


As shown in the Figure 2, in 3×3 super-cell, the starting point of Pt, say, at the center, and could diffuse into the nearby fourfold sites. Due to symmetry, the energy barriers for all four direction should be the same, so just consider one of the pathways. In this case, energy of the system is calculated for Pt on the center site and on the edged site.

To get energies of each initial and final state, all calculations are performed with CASTEP, functional used is GGA PBE, pseudo-potential is OTFG-ultrasoft, and all other parameters are set to be the same as above when doing slab-size optimization.

After calculations are done, and comparing the two energies and check the relative difference, and based upon that difference, one will decide whether it necessary to keep using 3×3 super-cell or increase the slab size to 4×4 super-cell or even larger.

Then, in order to find out the transition state, one need to build the initial and final state or the reactant and product state respectively. There are two possible diffusion processes, one is the hopping between two fourfold sites, another is the concerted substitution of Pt adatom with Pt on the top layer. And in the calculations, two assumptions will be made to simplify the problem and reduce computational cost:

  1. In either process, Pt atom will only diffuse with the closest Pt atom or fourfold site.
  2. Due to the fact that system used has already optimized its size, and due to the symmetry, only consider Pt adatom diffuse in one direction, instead of four.

Based upon these assumptions, two sets of reactant and product slabs will be built for corresponding diffusion pathways.


Figure 3. Transition process scheme for hopping between fourfold states.

Figure 4. Transition process of concerted substitution of Pt adatom with Pt atom on the surface.

After determining the initial and final state of the process, DMol3 TS-search will be used to find the transition state/energy for each process while comparing transitional energy calculated with different search protocols.

Data analysis and discussion:

For the slab size optimization, calculations were performed for 3×3 super-cell where the Pt adatom sits in the fourfold site in the middle, and the fourfold site on the edge, and the energies are close enough to say they are in the same environment.

For the manually adjusted Pt adatom positions, three-point-adjust method is used to iteratively adjust and narrow down the height range and get to the lowest energy and its corresponding height/distance. One could see from the plot that at 1.8Å above the surface, the energy is the lowest.

Figure 5. Energy diagram of Pt adatom with relative heights to the slab surface.

After that, a 5 layer, 3×3 super slab is applied for the Transition-State study.

In Castep transition state search, there are some different synchronous transit methods[3], and here, some of these methods were used and were compared their differences. For the fourfold to fourfold hopping, the transition energies for different TS-search protocols are shown in the Table 1 below:

Table 1. Transition energy of hopping between fourfold sites calculated from different TS-search protocol.

For concerted substitution, the transition energy for each TS-search protocol is also listed in the table2.

Table 2. Transition energy of concerted substitution calculated from different TS-search protocol.

Different transition searching protocols have different calculation process, but for each process, they are all in agreement with the transition energies are on the same magnitude. While for Pt substitution process, the transition energy barrier is ten times larger than that of hopping process, which makes sense that such process requires breaking Pt metallic bonds with the surrounding Pt atoms and then another Pt atom comes in and forms new bonds, there should be a lot more energy required for such reaction.

Conclusion:

Based upon the energy barrier calculated from the Transition-Search, it is obvious that the concerted substitution has way larger energy barrier than the fourfold sites hopping, which means at same conditions(say same temperature) it will be much less likely for Pt adatom diffuse into the Pt(100) surface and undergoes the concerted substitution process.

There are some experimental setups that could be improved, say the slab I used has 5 layers, which I did not optimize. Also, I stopped at 3×3 supercell size and did not look at 4×4 supercell simply because the energy between two fourfold sites are very close to each other(~0.005 hartree for the total system) for 3×3 supercell, but maybe 4×4 will give even more identical energy, I do not know and maybe someone could try 4×4 disregarding the computational cost.


Reference:

  1. J.P. Perdew, K. Burke, M. Ernzerhof, Generalized gradient approximation made simple, Phys. Rev. Lett., 77 (1996)

2. J.P. Perdew, J.A. Chevary, S.H. Vosko, K.A. Jackson, M.R. Pederson, D.J. Singh, C. Fiolhais,      Atoms, Molecules, Solids, And Surfaces – Applications of the Generalized Gradient  Approximation for Exchange and Correlation, Phys. Rev. B, 46 (1992)

3. CASTEP GUIDE, Transition state search task. Date of access: April. 27. 2019

https://www.tcm.phy.cam.ac.uk/castep/documentation/WebHelp/content/modules/castep/tskcasteptss.htm

A brief introduction to the theory, parameterization and application of Projector Augmented Wave (PAW) datasets to plane wave DFT calculations

by Brandon Bocklund

Introduction

Many of the observable properties that makes materials interesting are linked to the electronic structure, so it is desireable with to perform DFT calculations with the most accurate computational methods that are affordable. Calculations within DFT scale as \( \mathcal{O}(n^3) \) for n electrons [1], so many technologically important materials, including transition metals such as Fe, are computationally demanding to calculate when considering all the electrons. This is exacerbated for core electrons, since the wave functions near the nuclei tend to oscillate, requring a large number of plane waves required to describe the wave functions near the nuclear cores in extended systems. Since many key properties are influenced by the outermost valance electrons that control bonding, it is sensible to fix the core electrons and treat them approximately to make calculations of the same level of theory more affordable or to make more complex calulations affordable. Treating core electrons as fixed is known as the frozen core approximation.

In this post, different cutoff radii will be used to generate PAW datasets for Ti. Differences in the generated PAW datasets will be demonstrated by comparing the cutoff energy required to converge the energies of hcp Ti and by comparing the formation energy of TiO2.

Treating core electrons

Core and valence electrons

Typically there are two main parameters to consider when treating electrons as core or valence that effect how the wave functions will be constructed: the core radius and the number of core vs. valence electrons. The core radius is the spherical distance from the center of the atom that forms the outer bound for the approximation to the wave functions. The number of electrons in the core vs. valance is simply the partition of how many electrons of charge density an atom can contribute to bonding. For example, Ti has 22 electrons that must be partitioned between core and valance. Both of these parameters are typically chosen by the person developing the new description.

A basic description of some methods for treating core electrons in extended systems follows.

Pseudopotentials

Pseudopotentials replace the core wave functions with a pseudo wave function with the goal of defining a smooth function to represent the effective potential of the core. The pseudo wave function are constructed so that the value and the derivative of the pseudo wave function matches the value and derivative of the true wave functions at the core radius. The advantage of pseudopotentials is their formal simplicity, however the pseudo wave function prevents the recovery of the full core electron wave functions. James Goff published a post on pseudopotentials [2] that describes their construction in a detailed, introductory way.

LAPW

Another method for treating core electrons is the Linear Augmented Plane Wave (LAPW) method. The main idea of this method is that two partial waves, which can be used to describe the all-electron wave functions, are joined at the core radius and matched to the all-electron solution. Thus, the main advantage is the core wave functions can be recovered, but this method comes at a higher computational cost than the pseudopotential method. A more complete description of the pseuodpotential and LAPW methods can be found in [3].

PAW

The Projector Augmented Wave (PAW) method presented by Blöchl [4] as a formalism that generalizes and combines favorable aspects of the pseudopotential and LAPW methods through projector functions. The basis of the PAW method is the combination of partial wave functions from the isolated atom with pseudo partial waves. The PAW method defines a transformation operator that maps the pseudo wave functions onto the all-electron wave functions,
\begin{equation} \left| \Psi \right> = \mathcal{T} \left| \tilde\Psi \right> \end{equation}
for the all-electron wave function, \( \left| \Psi \right> \), the transformation operator, \( \mathcal{T} \), and the pseudo wave functions \( \left| \tilde\Psi \right> \). The transformation operator is defined as
\begin{equation} \mathcal{T} = 1+ \sum_i \left( \left| \phi \right> – \left| \tilde\phi \right> \right) \left< \tilde p_i \right|\end{equation}
where \( \left| \phi \right> \) and \( \left| \tilde\phi \right> \) are the all-electron partial waves and pseudo partial waves, respectively, and \( \left< \tilde p_i \right| \) are the projectors that are constructed to match the all-electron solution. In the PAW method, PAW datasets are generated that can recover the full core electron wave functions, like the LAPW method, but at a lower cost than the LAPW method, closer to the computational cost of pseudopotentials. More information can be found for the PAW method in [4-6] and more detailed description of the relationship between pseudopotentials, APW, and the PAW methods can be found in [4].

Calculation details

Calculations are performed using plane waves and the PBE functional implemented by Quantum Espresso [8] in the pwscf code. PAW datasets [4] are used to describe the core states. For Ti, PAW datastets are generated as part of this work with the ld1 code distributed with Quantum Espresso, based on the PS Library 1.0 parameterizations [9]. The PS Library 1.0 parameterization for O is used directly. The reference states for Ti and O are chosen as hcp Ti and the O2 molecule in a 10x10x10 fcc box. The size of the O2 box was converged to within 0.1 mRy. Detailed discussion of the convergence of the box size is out scope for this post.

The cutoff energy convergence of the different potentials are compared in the following sections below for Ti and TiO2. Oxygen cutoff energy was converged to 0.1 mRy at a wavefunction cutoff energy of 90 Ry and a kinetic energy cutoff of 720 Ry. For the calculation of formation energy, the maximum converged cutoff energy for each set of potentials is used across all structures. In all cases, Ti required a larger cutoff energy for convergence than O, so it was used for the calculations of TiO2.

The kpoint grids were converged to within 0.1 mRy. For hcp Ti, an 11x11x7 Monkhorst-Pack grid was used. For the O2 box, a 3x3x3 Monkhorst-Pack grid, and for rutile TiO2 a 4x4x7 grid. Showing the detailed kpoints convergence tests are out of scope for this study. Even though the different PAW datasets can lead to different electronic structures and kpoints convergence, a single set of kpoints for each set of structures were used across all of the different PAW datasets for simplicity.

For comparing the cutoff energy of hcp Ti, calculations with each PAW potential used the same structure, a hexagonal primitive cell with a lattice parameter of 5.8 a.u. and a c/a ratio of 1.58 (corresponding to the experimental c/a ratio). All static calculations were performed using tetrahedron integration and an energy convergence of 1e-8 Ry. For calculations of the formation energy, the cells and ionic positions for all cells (O, Ti for each potential, TiO2 for each potential) were relaxed with a force convergence criteria of 1e-9 Ry/bohr. The Brillouin zone integration for relaxations was treated with Gaussian smearing with a smearing width of 0.001 Ry.


Generating PAW datasets for Ti

The ld1 program was used to generate the PAW datasets. The documentation can be found online [10]. The starting point for the tests here is the input file for generating a PAW dataset for the spin polarized, scalar relativistic [12] Ti from the PS Library version 1.0.0 [9]. The input file for the PS Library starting point follows below. The settings here create a PAW dataset for Ti with Troullier-Martins pseudization [11] via Bessel functions. The the key inputs that will be changed is `rcore`, which is the matching radius in atomic units for the core charge smoothing. The bottom section describes the number of wave functions (6) that will be pseudized and which are described by the lines below. Taking the first line (3S) as the example, the first number is the principle quantum number (n=1, starting with 1 for the lowest s, 2 for the lowest p), then the angular momentum quantum number (l=0), followed by the number of occupying electrons, the energy used to pseudize the state (=0.00), the matching radius for the norm-conserving pseudopotential (=0.85), the matching radius for the ultrasoft pseudopotential (=1.30) and finally the total angular momentum (=0.0). Changing the norm-conserving or ultrasoft pseudopotential matching radii do not change the PAW dataset, since the radii are controlled by the input parameters above. Note that the energies for the unbound states (4p=4 Ry and unoccupied 3d=0.05 Ry) need to be non-zero.

&input
title='Ti',
zed=22.,
rel=1,
config='[Ar] 4s2 4p0 3d2',
iswitch=3,
dft='PBE'
/
&inputp
lpaw=.true.,
pseudotype=3,
file_pseudopw='Ti-PSL.UPF',
author='ADC',
lloc=-1,
rcloc=1.6,
which_augfun='PSQ',
rmatch_augfun_nc=.true.,
nlcc=.true.,
new_core_ps=.true.,
rcore=0.8,
tm=.true.
/
6
3S 1 0 2.00 0.00 0.85 1.30 0.0
4S 2 0 2.00 0.00 0.85 1.30 0.0
3P 2 1 6.00 0.00 0.80 1.60 0.0
4P 3 1 0.00 4.00 0.80 1.60 0.0
3D 3 2 2.00 0.00 0.80 1.50 0.0
3D 3 2 0.00 0.05 0.80 1.50 0.0

To demonstrate how the cutoff radius affects the calculation accuracy and expense (through the cutoff energy), two new PAW datasets will be generated with core radii of 0.4 a.u. (much smaller, further referred to as “small core”) and 2.0 a.u. (much larger, further referred to as “large core”). Note that these are note expected to be accurate, but instead to demonstrate how the parameters affect might affect calculations and impress the care and detail that should be given to generating proper potentials.

Energy cutoff convergence of Ti and formation energy TiO2

Figure 1a and 1b compre the relative and absolute energy convergence with respect to the wave function energy cutoff for the differently generated Ti PAW datasets. In Figure 1a, the PS Library converges at a wave function cutoff energy of 120 Ry, the large core at 110 Ry, and the small core does not converge to less than 0.1 mRy/atom even at 140 Ry. Computational demands and the instability of the PAW dataset limited the full convergence.

The cutoff energies follow the trend that would be expected. Compared to the default PS Libary PAW dataset, increasing the core radius allows for more of the wave function to be described by the core, and therefore the dataset is softer (requires smaller energy cutoffs). In addition, the small core is not converged even at 140 Ry because the smaller radius requires a harder potential with more plane waves being required to describe the wave function. Figure 1a also shows unusual behavior for the energy to not decrease variationally with the cutoff energy and instead shows that there was some osciallation in the energy with increasing energy cutoff. Note that the large core and the the PS Library default are quite close in energy, so the differences may be hard to see in both figures. Figure 1b aims to demonstrate that the energies for different pseudopotentials are different even for the same calculation settings, so they cannot be compared.

Figure 1a: Energy cutoff convergence relative to the energy calculated at a cutoff energy of 140 Ry. Energy differences are taken from 10 Ry to 140 Ry. Calculations not shown are outside the bounds of the plot.

Figure 1b: Energy convergence for cutoff energies ranging from 10 Ry to 140 Ry. Missing results at lower energy cutoff are off the scale of the plot.

As discussed previously, energies between different pseudopotentials cannot be directly compared, therefore a metric that can cancel the differences is desired. The formation energy of TiO2 can cancel the differences caused by the different treatment of Ti and give some insight into the practical implications of different treatments of the electronic structure. Using the cutoff energies found for Ti (120 Ry for PS Library, 140 Ry for small core, 110 Ry for the large core) the energies per atom of hcp Ti, O2 in a vaccuum box, and TiO2 are calculated. The formation energy of TiO2 is calculated in the usual way:
\begin{equation} E^\mathrm{form} = E_{\mathrm{TiO_2}} – (E_{\mathrm{Ti}} + E_{\mathrm{O_2}}) \end{equation}
Since in each case, the cutoff energies are convered for all calculations within each formation energy calculation, the formation energies can be safely compared even with different cutoff energies used between them.

StructurePS LibrarySmall coreLarge core
hcp Ti (Ry/atom)-183.6910-183.6974-183.6975
O (Ry/atom)-41.4776-41.4776-41.4776
TiO2 (Ry/atom)-89.1361-89.1363-89.1357
TiO2 formation (Ry/atom)-0.2541-0.2521-0.2515

The total energies and formation energies are shown in Table 1. The differences in the formation energy are larger than the convergence criteria (0.1 mRy/atom, 0.0001 Ry/atom) for the formation energies of the PS Library to the small core PAW dataset and the PS Library to the large core PAW dataset. The largest difference is 0.0026 Ry/atom for the small core and PS Library formation energies, which corresponds to above 3 kJ/mole-atom. Differences that large could impact the relative stability of TiO2 in a more comprehensive study that used inaccurate PAW datasets.

Conclusion

PAW datasets were reviewed in context of other types of frozen core approximations, then PAW datasets were generated for Ti with larger and smaller core radii than the ones parameterized in the PS Library v1.0.0. It was shown that the different core radii can affect the energy cutoff convergence, the total energy, and the formation energy of a compund, TiO2.

References

[1] Section 10.5, D.S. Sholl, J.A. Steckel, Density Functional Theory, John Wiley & Sons, Inc., Hoboken, NJ, USA, 2009. doi:10.1002/9780470447710.
[2] J. Goff, Transferability of Cu Pseudopotentials in Cu/CuO Systems, Density Funct. Theory Pract. Course. (2019). https://sites.psu.edu/dftap/2019/03/31/transferability-of-cu-pseudopotentials-in-cucuo-systems/.
[3] D.J. Singh, L. Nordstrom, Planewaves, Pseudopotentials and the LAPW Method, Second Edi, Springer US, 2006. doi:10.1007/978-0-387-29684-5.
[4] P.E. Blöchl, Projector augmented-wave method, Phys. Rev. B. 50 (1994) 17953–17979. doi:10.1103/PhysRevB.50.17953.
[5] X. Gonze, F. Finocchi, Pseudopotentials Plane Waves-Projector Augmented Waves: A Primer, Phys. Scr. T109 (2004) 40. doi:10.1238/physica.topical.109a00040.
[6] R.M. Martin, Electronic Structure: Basic Theory and Practical Methods, Cambridge University Press, 2004. doi:10.1017/CBO9780511805769.
[7] J.P. Perdew, K. Burke, M. Ernzerhof, Generalized Gradient Approximation Made Simple, Phys. Rev. Lett. 77 (1996) 3865–3868. doi:10.1103/PhysRevLett.77.3865.
[8] P. Giannozzi, S. Baroni, N. Bonini, M. Calandra, R. Car, C. Cavazzoni, D. Ceresoli, G.L. Chiarotti, M. Cococcioni, I. Dabo, A. Dal Corso, S. de Gironcoli, S. Fabris, G. Fratesi, R. Gebauer, U. Gerstmann, C. Gougoussis, A. Kokalj, M. Lazzeri, L. Martin-Samos, N. Marzari, F. Mauri, R. Mazzarello, S. Paolini, A. Pasquarello, L. Paulatto, C. Sbraccia, S. Scandolo, G. Sclauzero, A.P. Seitsonen, A. Smogunov, P. Umari, R.M. Wentzcovitch, QUANTUM ESPRESSO: a modular and open-source software project for quantum simulations of materials., J. Phys. Condens. Matter. 21 (2009) 395502. doi:10.1088/0953-8984/21/39/395502.
[9] A. Dal Corso, Pseudopotentials periodic table: From H to Pu, Comput. Mater. Sci. 95 (2014) 337–350. doi:10.1016/j.commatsci.2014.07.043.
[10] http://web.mit.edu/espresso_v6.1/amd64_ubuntu1404/qe-6.1/Doc/INPUT_LD1.html
[11] N. Troullier, J.L. Martins, Efficient pseudopotentials for plane-wave calculations, Phys. Rev. B. 43 (1991) 1993–2006. doi:10.1103/PhysRevB.43.1993.
[12] Koelling, D. D. & Harmon, B. N. A technique for relativistic spin-polarised calculations. J. Phys. C Solid State
Phys. 10, 3107–3114 (1977).

Calculating transition state and activation energy of Ag diffusion via adjacent threefold sites on Cu(111) surface

Author: Stephen Holoviak

Introduction:

Diffusion of adatoms on a surface is an important phenomena in many processes; from thin film deposition (1) to catalysis. This study is an attempt to understand the activation energy of an Ag atom diffusing between the adjacent threefold sites on the Cu(111) surface.

Figure 1: Threefold sites on Cu(111) surface.

Method:

All calculations were carried out in the Dmol3(2) package in materials studio.

Exchange-correlation functional used was LDA-PWC (3).

Kpoint density: 1x1x1, all meshes were distributed via the Monkhorst-pack method (4). If more computational resources were available, more k-points would be added.

SCF Tolerance: 10E-4 [eV]

Geometry Optimization Tolerance: 10E-4[Ha] = 0.0272[eV]

Orbital Cutoff: 3.4[Å] with an all electron core treatment and a double numeric (DN) basis set (5).

Convergence Testing:

The k-point mesh and SCF tolerance used in these calculations lead to unstable results that do not provide very accurate energies. Unfortunately, the computational resources available for this project were extremely limited and in order for the calculations to reach any result at all these extremely coarse parameters had to be used. The instability was confirmed by comparing the calculations against partial results with a SCF tolerance of 10E-6[eV] and a 4x4x1 k-point mesh. The system energies between the coarse calculations and the finer calculations varied by nearly 0.19[eV].

Calculations:

The reactant and product states of the reaction were defined as the hcp and fcc sites respectively.

A 3-layered 1×1 slab of Cu(111) with a vacuum spacing of 10[Å] was used for the calculations. An Ag atom was placed at the hcp site and the geometry of the Ag and all Cu layers were optimized in order to define the reactant state. An Ag atom was placed at the fcc site and the geometry of the system was optimized in order to define the product state. With more computational resources, this cell should probably be increased in size, with more unit cells and more layers, fixing the geometry of the bottom layers to represent the bulk material.

Figure 2: Reactant and product vacuum slabs used for transition state searching.

The transition state of the reaction was found using the complete LST/QST method as implemented in Dmol3 (6).

The energy of each image of the reaction was defined as follows:

E = E_{Ag|Cu(111)} - E_{Cu(111)} - E_{Ag}

Figure 3: Complete LST/QST transition state search.

The transition state was found to be the bridge site between the two threefold sites. While the exact numbers of the frequencies and energy at the transition state will not be very accurate, there was one imaginary frequency along the reaction coordinate that supports its identity as a transition state.

Figure 4: Reactant state, transition state, and product state structures.

The energy barrier found for the hcp to fcc transition was 0.051[eV], but the level of convergence for these calculations is on the same order of magnitude as this barrier, so the exact barrier cannot be determined from this study. The height of this barrier reported in literature is 0.023[eV] (7), giving the same order of magnitude as this study.

The energy of the two threefold sites was found to be slightly different, with the fcc site being 0.003[eV] more stable, however the calculations from this study cannot tell which one is actually more stable.

Conclusion:

Due to computational resource limitations, an exact value for the activation energy of Ag diffusing between adjacent threefold sites on Cu(111) could not be found, however the order of magnitude was determined to be 10E-3[eV]. The location of the transition state was found to be the bridge site in between the threefold sites, this location is supported by the presence of an imaginary frequency along the reaction coordinate. It was also found that the energy of the threefold sites is different, due to the presence(hcp) or absence(fcc) of a Cu atom directly below the site in the next layer, but it could not be determined which of these sites is more energetically favorable.

References:

(1)     M. Ohring (2001) “Materials Science of thin Films”, Section 7.4: “Kinetic Processes in Nucleation and Growth”, 386-400

(2)     B. Delley (2000) “From molecules to solids with the DMol3 approach” J. Chem. Phys. 113

(3)     J. Perdew, Y. Wang (1992). “Accurate and simple analytic representation of the electron-gas correlation energy”. Phys. Rev. B. 45 (23): 13244–13249.

(4)     H. Monkhorst, J. Pack (1976) “Special points for Brillouin-zone integrations.” Physical Review B, 13(12): 5188-5192

(5)     B. Delley (1990). “An All-Electron Numerical Method for Solving the Local Density Functional for Polyatomic Molecules”. J. Chem. Phys. 92: 508–517.

(6)     T. Halgren, W. Lipscomb (1977) “The synchronous-transit method for determining reaction pathways and locating molecular transition states.” Chem. Phys. Letters 49: 225-232

(7)     A. Kotri, E. El Koraychy, M. Mazroui, Y. Boughaleb (2017) “Static investigation of adsorption and hetero‐diffusion of copper, silver, and gold adatoms on the (111) surface” Surface and Interface Analysis, 49 (8)

A brief introduction to the theory, parameterization and application of Projector Augmented Wave (PAW) datasets to plane wave DFT calculations

Introduction

Many of the observable properties that makes materials interesting are linked to the electronic structure, so it is desireable with to perform DFT calculations with the most accurate computational methods that are affordable. Calculations within DFT scale as \( \mathcal{O}(n^3) \) for n electrons [1], so many technologically important materials, including transition metals such as Fe, are computationally demanding to calculate when considering all the electrons.This is exacerbated for core electrons, since the wave functions near the nuclei tend to oscillate, requring a large number of plane waves required to describe the wave functions near the nuclear cores in extended systems. Since many key properties are influenced by the outermost valance electrons that control bonding, it is sensible to fix the core electrons and treat them approximately to make calculations of the same level of theory more affordable or to make more complex calulations affordable. Treating core electrons as fixed is known as the frozen core approximation.

In this post, different electronic configurations and cutoff radii will be used to generate PAW datasets for Ti. Differences in the generated PAW datasets will be demonstrated by comparing the cutoff energy required to converge the energies of hcp Ti and TiO2 and by comparing the formation energy of TiO2 with calculated and experimental formation energies in the literature.

Treating core electrons

Core and valence electrons

Typically there are two main parameters to consider when treating electrons as core or valence that effect how the wave functions will be constructed: the core radius and the number of core vs. valence electrons. The core radius is the spherical distance from the center of the atom that forms the outer bound for the approximation to the wave functions. The number of electrons in the core vs. valance is simply the partition of how many electrons of charge density an atom can freely supply to the system. For example, Ti has 22 electrons that must be partitioned between core and valance. Both of these parameters are typically chosen by the person developing the new description.

A basic description of some comment methods for treating core electrons in extended systems follows.

Pseudopotentials

Pseudopotentials replace the core wave functions with a pseudo wave function with the goal of defining a smooth function to represent the effective potential of the core. The pseudo wave function are constructed so that the value and the derivative of the psuedo wave function matches the value and derivative of the true wave functions at the core radius.
The advantage of pseudopotentials is their formal simplicity, however the pseudo wave function prevents the recovery of the full core electron wave functions. James Goff published a post on pseudopotentials [2] that describes their construction in a detailed, introductory way.

LAPW

Another method for treating core electrons is the Linear Augmented Plane Wave (LAPW) method. The main idea of this method is that two partial waves, which can be used to describe the all electron wave functions, are joined are the core radius and matched to the all electron solution. Thus, the main advantage is the core wave functions can be recovered, but this method comes at a higher computational cost than the pseudopotential method. A more complete description of the psueodpotential and LAPW methods can be found in [3].

PAW

The Projector Augmented Wave (PAW) method presented by Blöchl [4] as a formalism that generalizes and combines favorable aspects of the pseudopotential and LAPW methods through projector functions. The basis of the PAW method is the combination of partial wave functions from the isolated atom with pseudo partial waves through projector functions that are constructed to match the all electron solution. In the PAW method, PAW datasets are generated that can recover the full core electron wave functions, like the LAPW method, but at a lower cost than the LAPW method, closer to the computational cost of pseudopotentials. More information can be found for the PAW method in [4-6] and more detailed description of the relationship between pseudopotentials, APW, and the PAW methods can be found in [4].

Calculation details

Calculations are performed using plane waves and the PBE functional implemented by Quantum Espresso [8] in the pwscf code. PAW datasets [4] are used to describe the core states. For Ti, PAW datastets are generated as part of this work with the ld1 code distributed with Quantum Espresso, based on the PS Library 1.0 parameterizations [9]. The PS Library 1.0 parameterization for O is used directly. The reference states for Ti and O are chosen as hcp Ti and the O2 molecule in a 10x10x12 box. The size of the O2 box was converged to within 0.1 mRy. Detailed discussion of the convergence of the box size of scope for this post.

The cutoff energy convergence of the different potentials are compared in the following sections below for Ti and TiO2. Oxygen cutoff energy was converged to 0.1 mRy at a wavefunction cutoff energy of 50 Ry and a kinetic energy cutoff of 200 Ry. For the calculation of formation energy, the maximum converged cutoff energy for each set of potentials is used across all structures.

The kpoint grids were converged to within 0.1 mRy are shown for each structure in the table below. Showing the detailed kpoints convergence tests are out of scope for this study. Even though the different PAW datasets can lead to different electronic structures and kpoints convergence, a single set of kpoints for each set of structures were used across all of the different PAW datasets for simplicity.

Generating PAW datasets for Ti

The ld1 program was used to generate the PAW datasets. The documetation can be found online [10]. The starting point for the tests here is the input file for generating a PAW dataset for the spin polarized, scalar relativistic Ti from the PS Library version 1.0.0 [9]. The input file for the PS Library starting point follows below. The settings here create a PAW dataset for Ti with Troullier-Martins pseudization [11] via Bessel functions. The the key inputs that we will change are the electronic configuration, `config` (and the corresponding psedized wave functions), and `rcore`, which is the matching radius in atomic units for the core charge smoothing. The bottom section describes the number of wave functions (6) that will be pseudized and which are described by the lines below. Taking the first line (3S) as the example, the first number is the principle quantum number (n=1, starting with 1 for the lowest s, 2 for the lowest p), then the angular momentum quantum number (l=0), followed by the number of occupying electrons, the energy used to pseudize the state (=0.00), the matching radius for the norm-conserving pseudopotential (=0.85), the matching radius for the ultrasoft pseudopotential (=1.30) and finally the total angular momentum (=0.0). Changing the norm-conserving or ultrasoft pseudopotential matching radii do not change the PAW dataset, since the radii are controlled by the input parameters above. Note that the energies for the unbound states (4p=4 Ry and unoccupied 3d=0.05 Ry) need to be non-zero.

&input
title='Ti',
zed=22.,
rel=1,
config='[Ar] 4s2 4p0 3d2',
iswitch=3,
dft='PBE'
/
&inputp
lpaw=.true.,
pseudotype=3,
file_pseudopw='Ti-PSL.UPF',
author='ADC',
lloc=-1,
rcloc=1.6,
which_augfun='PSQ',
rmatch_augfun_nc=.true.,
nlcc=.true.,
new_core_ps=.true.,
rcore=0.8,
tm=.true.
/
6
3S 1 0 2.00 0.00 0.85 1.30 0.0
4S 2 0 2.00 0.00 0.85 1.30 0.0
3P 2 1 6.00 0.00 0.80 1.60 0.0
4P 3 1 0.00 4.00 0.80 1.60 0.0
3D 3 2 2.00 0.00 0.80 1.50 0.0
3D 3 2 0.00 0.05 0.80 1.50 0.0

To demonstrate how the cutoff radius affects the calculation accuracy and expense (through the cutoff energy), two new PAW datasets will be generated with core radii of 0.4 a.u. (much smaller) and 2.0 a.u. (much larger). In addition, a different electronic configuration will be generated that does not pseudize the 3s or 3p core states. Note that these are note expected to be accurate, but instead to demonstrate how the parameters affect might affect calculations and impress the care and detail that should be given to generating proper potentials.

Energy cutoff convergence of Ti and TiO2

Formation energy of Ti and TiO2

References

[1] D.S. Sholl, J.A. Steckel, Density Functional Theory, John Wiley & Sons, Inc., Hoboken, NJ, USA, 2009. doi:10.1002/9780470447710.
[2] J. Goff, Transferability of Cu Pseudopotentials in Cu/CuO Systems, Density Funct. Theory Pract. Course. (2019). https://sites.psu.edu/dftap/2019/03/31/transferability-of-cu-pseudopotentials-in-cucuo-systems/.
[3] D.J. Singh, L. Nordstrom, Planewaves, Pseudopotentials and the LAPW Method, Second Edi, Springer US, 2006. doi:10.1007/978-0-387-29684-5.
[4] P.E. Blöchl, Projector augmented-wave method, Phys. Rev. B. 50 (1994) 17953–17979. doi:10.1103/PhysRevB.50.17953.
[5] X. Gonze, F. Finocchi, Pseudopotentials Plane Waves-Projector Augmented Waves: A Primer, Phys. Scr. T109 (2004) 40. doi:10.1238/physica.topical.109a00040.
[6] R.M. Martin, Electronic Structure: Basic Theory and Practical Methods, Cambridge University Press, 2004. doi:10.1017/CBO9780511805769.
[7] J.P. Perdew, K. Burke, M. Ernzerhof, Generalized Gradient Approximation Made Simple, Phys. Rev. Lett. 77 (1996) 3865–3868. doi:10.1103/PhysRevLett.77.3865.
[8] P. Giannozzi, S. Baroni, N. Bonini, M. Calandra, R. Car, C. Cavazzoni, D. Ceresoli, G.L. Chiarotti, M. Cococcioni, I. Dabo, A. Dal Corso, S. de Gironcoli, S. Fabris, G. Fratesi, R. Gebauer, U. Gerstmann, C. Gougoussis, A. Kokalj, M. Lazzeri, L. Martin-Samos, N. Marzari, F. Mauri, R. Mazzarello, S. Paolini, A. Pasquarello, L. Paulatto, C. Sbraccia, S. Scandolo, G. Sclauzero, A.P. Seitsonen, A. Smogunov, P. Umari, R.M. Wentzcovitch, QUANTUM ESPRESSO: a modular and open-source software project for quantum simulations of materials., J. Phys. Condens. Matter. 21 (2009) 395502. doi:10.1088/0953-8984/21/39/395502.
[9] A. Dal Corso, Pseudopotentials periodic table: From H to Pu, Comput. Mater. Sci. 95 (2014) 337–350. doi:10.1016/j.commatsci.2014.07.043.
[10] http://web.mit.edu/espresso_v6.1/amd64_ubuntu1404/qe-6.1/Doc/INPUT_LD1.html
[11] N. Troullier, J.L. Martins, Efficient pseudopotentials for plane-wave calculations, Phys. Rev. B. 43 (1991) 1993–2006. doi:10.1103/PhysRevB.43.1993.


Determination of the Activation Energy and Frequencies for the Diffusion of Ag on Cu(111) via Three-fold Hollow Sites

by Angela Nguyen

1. Introduction

The purpose of this project is to calculate the activation barrier for the diffusion of a Ag atom on a Cu(111) surface via adjacent three-fold hollow sites through the use of DFT with a plane wave basis set as implemented by the CAmbridge Serial Total Energy Package (CASTEP) module [1] in Materials Studio. To accomplish this task, the transition state for the diffusion must be determined and then verified via a vibrational frequency calculation and visual observation of the transition state. The vibrational frequency calculation was implemented using the Dmol module [2] in Materials Studio. The Cu(111) surface was chosen as it is the most stable surface of Cu. For the purpose of this project, the Ag atom will be diffusing from the fcc hollow site to the hcp hollow site on the Cu(111) surface.  From the DFT calculations, the transition state was determined to be where the Ag atom is crossing the bridge site on the Cu(111) surface. The activation barrier was then calculated to be 0.31 eV with an imaginary vibrational frequency at -31.37 \(cm^{-1}\).

2. DFT Parameters

Listed below are the parameters used for the optimization of the Cu(111) surface as implemented in CASTEP.

Exchange-Correlation Functional TypeGeneralized Gradient Approximations [3]
Exchange-Correlation FunctionalPerdew Burke Ernzerhof [4]
Relativistic TreatmentKoelling-Harmon [5]
Psuedopotential"On the fly" generated (OTFG) ultrasoft [6]
K point GridMonkhorst-Pack [7]
SpinUnrestricted
Energy Convergence2.0 x 10^-5 eV/atom
Max Force0.05 eV/A

For Cu, the cutoff radius for the above psuedopotential is 2.0 Bohr (1.06 Å) with 11 valence electrons in the following configuration \(3d^{10} 4s^{1}\). For Au, the cutoff radius for the above pseudopotential is 1.59 Bohr (0.84 Å) with 19 valence electrons in the following configuration \(4s^{2} 4p^{6} 4d^{10} 5s^{1}\).

Below is a list of parameters for the vibrational calculations of the transition state as implemented in Dmol.

Exchange-Correlation Functional TypeGeneralized Gradient Approximations [3]
Exchange-Correlation FunctionalPerdew Burke Ernzerhof [4]
Relativistic TreatmentKoelling-Harmon [5]
Core TreatmentAll Electron
K point GridMonkhorst-Pack [7]
Basis SetDouble Numerical plus d-functions (DND) v3.5

3. Methodology

3.1 Construction of Cu(111) Vacuum Slab and Convergence Check

A vacuum slab of Cu(111) consisting of 5 layers was constructed from bulk Cu with a vacuum spacing of 12 Å between each slab in which the bottom 3 layers of the slab was constrained to model the bulk. The construction of 5 layers for the vacuum slab was chosen to ensure that the bulk could be modeled by the bottom 3 layers. A more rigorous study in the future could be performed to determine whether varying the number of layers in the slab affects the activation energy. A vacuum spacing of 12 Å was used to ensure that the slabs were isolated from each other due to the periodic nature of DFT. Single point energy calculations were performed on the vacuum slab to ensure convergence with respect to k points and the cutoff energy. A kpoint mesh of 2x2x1 (2 irreducible kpoints) and an energy cutoff of 400 eV was chosen to be sufficient for convergence of future calculations. The Cu(111) surface was then geometrically optimized using the chosen kpoint grid and cutoff energy.

Figures 1 and 2 Figure 2 display plots of the cohesive energy per atom as a function of the number of irreducible k points and cutoff energy respectively as determined by Materials Studio. The black dotted lines represent the +/- 0.01 tolerance used to determine which kpoint grid and energy cutoff to use.

Figure 1. Cohesive energy (eV/atom) vs. Number of irreducible k points. The blue circles represent the data points obtained from DFT calculations in Materials Studio. The blue line is to help guide the eye across the plot. The black dashed lines represent the +/- 0.01 eV tolerance used to determine the optimal number of irreducible k point mesh. The red square represents optimal k point mesh that will be used in future calculations.

Figure 2. Cohesive energy (eV/atom) vs. Energy cutoff (eV). The blue circles represent the data points obtained from DFT calculations in Materials Studio. The blue line is to help guide the eye across the plot. The black dashed lines represent the +/- 0.01 eV tolerance used to determine the optimal energy cutoff. The red square represents optimal energy cutoff that will be used in future calculations.

Two different versions of the optimized Cu(111) surface was constructed with the Ag atom in either the fcc hollow site or the hcp hollow site. These will represent the initial and final states for the following transition state search respectively.

3.2 Transition State Search and Vibrational Frequency Calculation 

With the initial and final states for the diffusion of Ag on Cu(111) built, a linear interpolation of 10 images between the two states was performed. A transition search was then conducted using the above outlined CASTEP parameters using the “Complete LST/QST” algorithm [8] in Materials Studio. An option was chosen in Materials Studio that the initial and final states should be optimized before any transition state search calculation was performed. This was done because linear interpolation between optimized initial and final states failed. Once the transition state was found, a vibrational frequency calculation was performed on the transition state to determine if the transition state was reasonable or not. If it is reasonable, the vibrational calculation should result in one imaginary (negative) frequency in which Ag atom is moving along the reaction coordinate towards the hcp hollow site. In addition, visual inspection of the transition state was done to make sure it was reasonable.

4. Results

Figures 3 and 4 below depict the optimized initial and final states of Ag adsorbed onto Cu(111) on the fcc and hcp hollow site respectively.

Figure 3. Ag adsorbed onto the fcc hollow site of Cu(111). The light blue sphere represents Ag and the orange spheres represents Cu.

Figure 4. Ag adsorbed onto the hcp hollow site of Cu(111). The light blue sphere represents Ag and the orange spheres represent Cu.
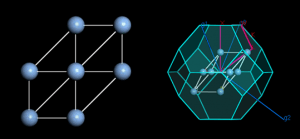
Figure 5 shows the transition state for the diffusion of Ag on Cu(111) via adjacent threefold hollow sites. From the figure, it can be seen that the transition state for the diffusion of Ag across Cu(111) is located along the reaction coordinate where the Ag atom is crossing the bridge site. It is reasonable for the transition state to be located here, since the Ag atoms will have to maneuver over two Cu atoms before settling in the adjacent hcp hollow site. The activation energy was determined to be 0.31 eV.

Figure 5. Transition state for the diffusion of Ag on Cu(111). The Ag atom is located along the bridge site of the surface. The light blue sphere is Ag and the orange spheres are Cu.

Lastly, in order to confirm the above transition state, a vibrational calculation was performed, which resulted in an imaginary frequency at -31.37 \(cm^{-1}\). To verify that this was a plausible vibrational frequency for the transition state, a visualizer in Materials Studio was used to view this vibration, which can be seen in Figure 6. From the figure, it can be seen that the Ag atoms is moving along the reaction coordinate towards the hcp hollow site while crossing the bridge site. This confirms that a proper transition state was found for the diffusion of Ag on Cu(111).

The table below shows the activation energy and imaginary frequency as calculated in this post.

Activation Energy [eV]Frequency [\(cm^{-1}\)]
"Theoretical"0.31-31.37
Literature [9]0.023

5. Conclusions

For the diffusion of Ag on Cu(111) via adjacent hollow sites, it was determined that the transition state is located at the bridge site with an activation energy of 0.31 eV. This was further confirmed through visual observation and by checking for one vibrational frequency for the transition state. One imaginary vibrational frequency was located at -31.31 \(cm^{-1}\) corresponding to the Ag atoms crossing the bridge site towards the adjacent hollow site.

From literature, Kotri et al. stuided the hetero-diffusion of metal atoms on other metal surfaces via adjacent hollow sites [9]. One such surface that they tested was the hopping of Ag on Cu(111) using Large-scale Atomic/Molecular Massively Parallel Simulator (LAMMPS) [10]. To determine the activation energy, Kotri et al. used the drag method in which the adatom is dragged from its inital site to the nearest empty site [9]. At each step, the adatom is then allowed to relax with the respect to the plane perpendicular to its motion. In their work, it was determined that the activation energy for Ag on Cu(111) was 0.023 eV, an order of magnitude less than the activation energy determined by this project. Interesting to note is that the activation barrier for the Ag atom hopping from the fcc hollow site to the hcp hollow site and vice versa was the same. For this project, the activation energy varied by 0.08 eV depending on which path the Ag atom took.

Reasons for the deviation between activation energies can be due to the difference in methodologies on how the transition state was obtained, how much “optimized” the initial and final states were, and the number of kpoints sampled. The “Complete LST/QST” algorithm could not be the most accurate method to use to find the transition state as it only optimizes the image with the highest energy, while leaving the other images untouched. Even though the transition state was “confirmed” to be correct through vibrational frequency analysis, it would be useful to run another transition state search method to verify if the current activation energy is correct. One such algorithm to use the nudged elastic band (NEB) method in which all images are optimized rather than the image with the maximum amount of energy in the “Complete LST/QST” method. When viewing the optimized inital and final images (Figures 3 and 4), it can be seen that the Ag atom is not located in the middle of each hollow site, where the highest symmetry of the site is. This could lead to higher energy values calculated as this would be the Ag would have to diffuse a longer distance between the fcc and hcp hollow sites. Lastly, a number of kpoints sampled in the Brillouin zone could be increased to sample any missed phenomenon in the system that was not detected before.

6. References

[1] Clark Stewart J et al., “First principles methods using CASTEP ,” Zeitschrift für Kristallographie – Crystalline Materials , vol. 220. p. 567, 2005.
[2] B. Delley, J. Chem. Phys. 92, 508 (1990).
[3] J. P. Perdew, K. Burke, and M. Ernzerhof, “Generalized Gradient Approximation Made Simple,” Phys. Rev. Lett., vol. 77, no. 18, pp. 3865–3868, Oct. 1996.
[4] J. P. Perdew et al., “Atoms, molecules, solids, and surfaces: Applications of the generalized gradient approximation for exchange and correlation,” Phys. Rev. B, vol. 46, no. 11, pp. 6671–6687, Sep. 1992.
[5] D. D. Koelling and B. N. Harmon, “A technique for relativistic spin-polarised calculations,” J. Phys. C Solid State Phys., vol. 10, no. 16, pp. 3107–3114, Aug. 1977.
[6] D. Vanderbilt, “Soft self-consistent pseudopotentials in a generalized eigenvalue formalism,” Phys. Rev. B, vol. 41, no. 11, pp. 7892–7895, Apr. 1990.
[7] H. J. Monkhorst and J. D. Pack, “Special points for Brillouin-zone integrations,” Phys. Rev. B, vol. 13, no. 12, pp. 5188–5192, Jun. 1976.
[8] Halgren, T. A.; Lipscomb, W. N. Chem. Phys. Lett., 49, 225 (1977).
[9] A. Kotri, E. El koraychy, M. Mazroui, and Y. Boughaleb, “Static investigation of adsorption and hetero-diffusion of copper, silver, and gold adatoms on the (111) surface,” Surf. Interface Anal., vol. 49, no. 8, pp. 705–711, Aug. 2017.
[10] LAMMPS User Manual 30, Sandia National Laboratories (Oct 2014) 2.

Band structure and density of states of Ag and Ag2O

by Wilson Yanez

One of the most fundamental ways to differentiate a material from being a metal or an insulator is by computing the energy states of its electrons near the Fermi level. If there is a continuous number of states the material will show a metallic behavior and if there is an energy range in which there are no states available near the Fermi energy (band gap) it will be an insulator [1]. For this reason, correctly determining the number of states at a given energy (density of states) or the energy of these states at a given momentum (band structure) plays one of the most important roles in studying solids and a great amount of physical information (such as electrical conductivity or optical response) can be extracted from them.

In this post we compute the density of states and band structure of Ag and Ag2O as a mean to explore the capabilities of DFT to differentiate between a metal and an insulator through the appearance of a gap near the Fermi energy in the band structure.

Our approach was to fist define the respective unit cell and Brillouin zone of Ag and Ag2O as can be seen in figure 1 and 2. Then we compute its density of sates (DOS) with a different k point mesh. Once we have a well converged calculation (no change in the DOS) we compute the band structure which has a higher computational demand.

Figure 1: Unit cell (left) and Brillouin zone (right) of Ag.

Figure 2: Unit cell (left) and Brillouin zone (right) of Ag2O.

Calculation Parameters

We use a plane wave basis set from CASTEP, a generalized gradient approximation (GGA) Perdew, Burke and Ernzerhof (PBE) functional and an on the fly generated (OTFG) pseudopotential [2,3]. The core radius is RC=2.40 Bohr (1.27 Å) and the electronic configuration is 4s2 4p6 4d10 5s1. The energy cutoff is 500 eV and the smearing scheme is Gaussian with a width of 100 meV.

Calculation

We first obtain the DOS of both Ag (figure 3) and Ag2O (figure 4) with different k point meshes and study its convergence. We noticed that using an 8x8x8 mesh, the difference in the DOS is less than 0.8 electron/eV and that it shows the general shape of the DOS reported in the literature [4]. As can be seen in figure 3 and 4, the number of k points has a significant impact in the results of our calculation. We can also see that our calculations show a non zero density of states near the Fermi energy for both Ag and Ag2O which is characteristic of a metal and opposes the measured insulating behavior of Ag2O.

Figure 3: DOS of Ag computed with a single k point (a) and with a 8x8x8 k point mesh (b)

Figure 4: DOS of Ag2O computed with a single k point (a) and with a 8x8x8 k point mesh (b)

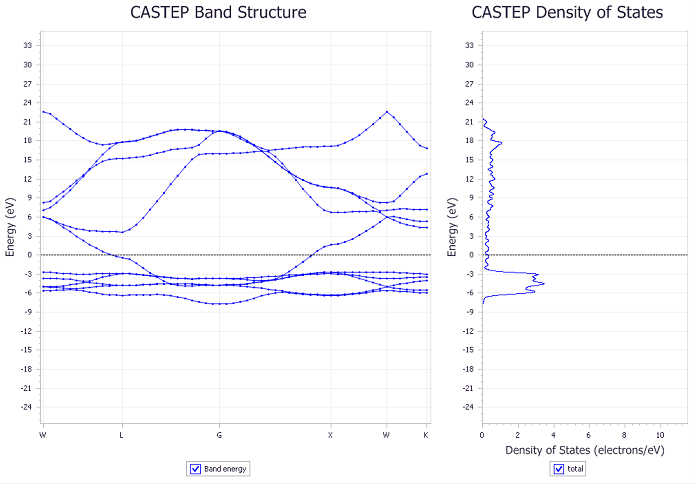
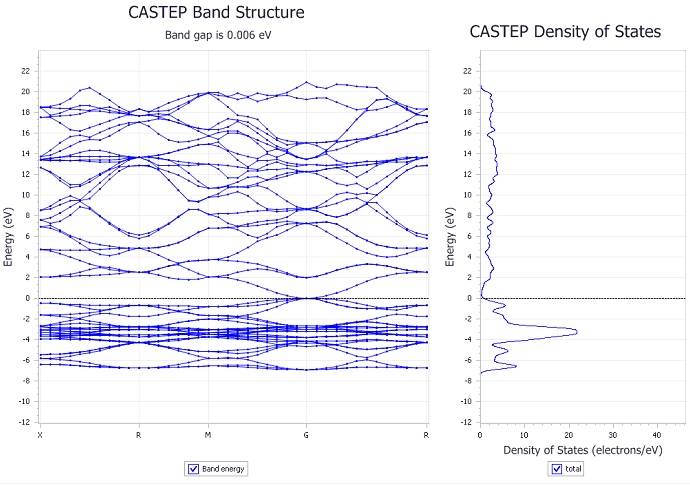
After finding the DOS, we compute the band structure of Ag and Ag2O as can be seen in figures 5 and 6.  Here again, we see that the band structure is non zero at the Fermi level, once again confirming the metallic behavior predicted by the density of states. It is important to acknowledge that the reported band gap in figure 6 of 6 meV is comparable to the uncertainty in our calculations. Thus it is not significant enough to be considered a real physical effect. This can also be seen in figure 7 where we show a close up image of the band structure near the Fermi energy of the material.

Figure 5: Band structure (left) and DOS (right) of Ag

Figure 6: Band structure (left) and DOS (right) of Ag2O

Figure 7: Zoom in image of the band structure (left) and DOS (right) of Ag2O near the Fermi level

To have a more realistic realization of the actual physics in Ag2O we compute the DOS and band structure including spin orbit coupling. This is a second order relativistic correction to the energy of the solid that takes into account the effect of the angular momentum of its orbitals on the electronic spin degree of freedom. Thus giving a more realistic representation of its physical behavior.  With this in mind, we see that a narrow band gap of 69 meV appears in the material. We also see small changes in the degeneracy of the band structure in comparison to the non spin orbit interaction case.

Figure 8: Band structure (left) and DOS (right) of Ag2O including spin orbit coupling

Figure 9: Zoom in image of the band structure (left) and DOS (right) of Ag2O near the Fermi level including spin orbit coupling.

It has been reported that the error in the determination of the band gap comes from the self interaction in the occupied bands which can be overcome by using  hybrid functionals like HSE03 and HSE06 [5]. Nevertheless, with these functionals we were unsuccessful in archiving convergence of our calculations even by changing the width of our smearing scheme.

Conclusions

We can see that DFT calculations have a hard time at estimating the DOS and band gap of insulating materials.  Thus, it is necessary to have extra caution while doing predictions at these energies.

The determination of the DOS and band structure strongly depends of the density of k points that we use in our calculation.

By introducing the spin orbit interaction we have been able to qualitatively predict the insulating behavior of Al2O. Nevertheless, we have not been able to quantitatively predict its band gap given that our result (0.69 eV) is roughly half the actual experimental value (1.3 eV) [5].

References

[1] C. Kittel. Introduction to Solid State Physics, 7th Edition. Wiley

[2] J. P. Perdew K. Burke, Y. Wang. Phys. Rev. B 57, 14999 (1998)

[3] Perdew, J. P; Burke, K; Ernzerhof, M. Phys. Rev. Lett. 77, 3865-3868 (1996)

[4] Sholl, D. & Steckel, J. A. Density Functional Theory: A Practical Introduction. (John Wiley & Sons, 2011).

[5] Allen, J. P., Scanlon, D. P. and Watson. G. W.  Phys. Rev. B 84, 115141 (2011)

Calculation of Activation Energy and Frequencies for Ag Diffusion between Adjacent Threefold Sites on Cu (111) Surface.

Author : Shyam Deo

Introduction

In order to understand formation of nanostructures, it is necessary to understand the underlying microscopic processes, such as adsorption, desorption, and diffusion. In the current study, we focus on the dynamics of a single adatom of silver (Ag) for diffusion between adjacent three-fold sites on Cu (111) surface. The activation energy for diffusion has also been calculated along with the frequencies of diffusion.

Methods

Plane-wave Density Functional Theory (DFT) calculations were carried out using the Vienna Ab Initio Simulation Package (VASP), version 5.4.4. The electron-electron exchange and correlation energies were computed using the Perdew, Burke, and Ernzerhof functional (PBE) [1]. The projector augmented-wave (PAW) [2] method was used to represent the ion-core electron interactions. For Cu, the cutoff radius for the above psuedopotential is 2.3 Bohr (1.22 Å) with 11 valence electrons in the following configuration 3d10 4s1. For Ag, the cutoff radius for the above pseudopotential is 2.4 Bohr (1.27 Å) with 11 valence electrons in the following configuration 4d10 5s1. The structural convergence criteria were 0.05 eV Å-1 for all unconstrained atoms, while the convergence criteria defining self-consistency of the electron density was 10-5 eV.

Figure 1: (a) Cu (111) 3×3 unit cell with 5 layers and vacuum. (b) Convergence test for k-points. (c) Convergence test for ENCUT

A Cu FCC experimental bulk lattice constant of 3.615 Å was used for building Cu (111) surface [3]. A five layered 3 x 3 unit slab of Cu (111) was used for surface calculations where the bottom three layers were frozen during the optimization and the top two layers were unconstrained (Figure 1a). A plane wave energy cutoff of 450 eV and Monkhorst-Pack [4] k-point mesh of 5 x 5 x 1 was used for all surface slab calculations after proper convergence tests described in the next section. To minimize spurious interslab dipole interactions between the periodic slabs, a vacuum space of 15 Å was used and dipole corrections were added in the direction perpendicular to the surface. Transition state was located using the climbing image nudged elastic band (CI-NEB) method [5] (5 images) by relaxing the reaction tangent force below 0.05 eV Å-1.Transition state was verified to contain a single imaginary frequency along the reaction coordinate. These vibration frequencies were calculated by the tag IBRION = 7 implemented in VASP. It determines the Hessian matrix (matrix of the second derivatives of the energy with respect to the atomic positions) using density functional perturbation theory [6-7].

Convergence Tests 

Convergence test for K-points mesh sampling the brilliouin zone was done at a plane wave energy cut off of 550 eV by varying the k-points against the single point energy of Cu (111) surface. The relative energies are plotted against the number of irreducible k-points as shown in Figure 1b. The energy varied by an amount 0.006 eV between 13 and 24 irreducible K-points. However, the energy fluctuated when the K-points were raised further. To reduce the computation cost, lower K-points were chosen due to limited availability of computational resources which should be a reasonable starting point because we are mostly concerned with a difference in energies between different systems and not the absolute numbers themselves. Then for ENCUT convergence, the cut-off energy for plane wave was varied from 350 eV to 550 eV as plotted in Figure 1c. The energy changed only by 0.017 eV between 450 eV and 550 eV. Finally, the k-points mesh of 5x5x1 with 13 irreducible K-points and a plane wave energy cut off of 450 eV was considered suitable for all subsequent surface calculations of adsorption energies.

Results and Discussions

Adsorption of Ag Atoms over Cu (111)

A Cu (111) surface has two types of three-fold binding sites available for adsorption by a silver atom – hollow-fcc and hollow-hcp sites shown in Figure 2a. The figure shows adjacent hollow-fcc and hollow-hcp sites. A hollow fcc site is a three fold site with no atom directly below  but with an atom in the layer next to it. A hollow hcp site is a three fold site with an atom directly below  and  with no atom in the layer next to it. We probed the adsorption of silver atom over 3×3 Cu (111) unit cell over these two adjacent sites.

The adsorption energy for Ag was calculated as:

Eads,Ag = EAg* – EAg – E*

where Eads,Ag is the adsorption energy of Ag, EAg* is the energy of Ag bound to the surface, EAg is the energy of single Ag atom and E* is the energy of the bare Cu(111) surface. The adsorption energies for the two adjacent three-fold sites are labelled in Figure 2b. Both sites show the same adsorption energy of 2.38 eV (Figure 2b and 2c). These two states obtained were then studied for diffusion between the two adjacent sites and the activation energy was probed for the same.

Figure 2: a) Cu (111) surface showing two adjacent hollow-fcc and hollow-hcp sites of adsorption, b) Ag atom adsorbed on a hollow-fcc site on Cu (111) and c) Ag atom adsorbed on a hollow-hcp site on Cu (111). Adsorption energies for the two states of adsorption are also shown for comparison.

Activation Energy for Diffusion

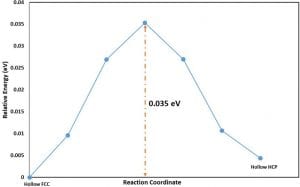
The two states with adsorption of Ag over hollow-fcc site and hollow-hcp site was used as two end points for NEB calculation. The former was used as the initial state while the later was taken as the final state after diffusion from the hollow-fcc site to the hollow-hcp site. The intermediate images for NEB run were obtained using linear interpolation to give five images along the straight line trajectory for diffusion between the two adjacent sites. The energy profile for images along the reaction coordinate obtained from BEB run is shown in figure 3. The transition state is also shown. The activation energy obtained is 0.0328 eV for diffusion from hollow fcc site to hollow hcp site while the activation energy for reverse diffusion obtained is 0.0305 eV. A bridge site adsorption of Ag was obtained as the transition state (one with the highest energy). This was confirmed for single imaginary frequency (with value -1.89 THz) along the reaction coordinate (from hollow-fcc to hollow-hcp and back vibration). The other two vibration frequencies obtained were 4.12 THz (vibration towards the plane of surface and away) and 1.01 THz (vibration parallel to the plane of adsorption). A single imaginary frequency along the reaction coordinate confirms the transition state for diffusion from hollow-fcc to the adjacent hollow-hcp site. All vibrational frequencies are reported in Figure 4 (a).

Figure 3: Energy profiles computed using NEB (5 images) for diffusion of Ag atom from hollow-fcc site to hollow-hcp site of adsorption. The TS state is labelled and the transition state structure is shown.

The frequencies of hopping was then calculated by the following expression as a function of temperature (Figure 4) where ΔE is the activation energy for hopping, ν1 to νN are  the vibrational frequencies associated with the minimum initial state (hollow-fcc site adsorption) and ν†1 to ν†N-1 are  the real vibrational frequencies associated with the transition state. The rate of hopping has been plotted in Figure 4b as a function of temperature.

Figure 4: (a) Vibrational frequencies in THz for Ag atom adsorption over hollow fcc site and transition state (bridge site)  on Cu (111) and (b) hopping rate for Ag atom on Cu (111) as a function of temperature (K)

Conclusion

NEB calculations for diffusion from the hollow-fcc site adsorption of Ag to the adjacent hollow-hcp site was studied and an activation barrier of 0.0328 eV was obtained. These two sites showed same adsorption energies of 2.38 eV. As a further study, diffusion coefficient can be calculated by ab initio methods from the calculated activation energies and adsorption energies as done earlier by Minkowski et al. for Cu adatoms over Cu (111) surfaces [8]. The calculated adsorption energies and activation barrier for Ag adatom matches reasonably with the reported values of 2.43 eV and 0.023 eV, respectively [9]. The coefficients for surface diffusion and rate for hopping can help understand aggregation of atoms on surfaces to form clustered particles of metals on the catalyst support.

References

  1. Perdew, J.P. and Y. Wang, Accurate and simple analytic representation of the electron-gas correlation energy. Physical Review B, 1992. 45(23): p. 13244-13249.
  2. Blöchl, P.E., Projector augmented-wave method. Physical Review B, 1994. 50(24): p. 17953-17979.
  3. Straumanis, M.E. and L.S. Yu, Lattice parameters, densities, expansion coefficients and perfection of structure of Cu and of Cu-In [alpha] phase. Acta Crystallographica Section A, 1969. 25(6): p. 676-682.
  4. Monkhorst, H.J. and J.D. Pack, Special points for Brillouin-zone integrations. Physical Review B, 1976. 13(12): p. 5188-5192.
  5. Nudged-elastic band used to find reaction coordinates based on the free energy. The Journal of Chemical Physics, 2014. 140(7): p. 074109.
  6. S. Baroni, P. Giannozzi and A. Testa, Phys. Rev. Lett. 58, 1861 (1987).
  7. X. Gonze, Phys. Rev. A 52, 1086 (1995); X. Gonze, Phys. Rev. A 52, 1096 (1995).
  8. Mińkowski, M. and M.A. Załuska-Kotur, Diffusion of Cu adatoms and dimers on Cu(111) and Ag(111) surfaces. Surface Science, 2015. 642: p. 22-32.
  9. Kotri, A.El koraychy, E.Mazroui, M., and Boughaleb, Y. ( 2017Static investigation of adsorption and hetero‐diffusion of copper, silver, and gold adatoms on the (111) surfaceSurf. Interface Anal.49705– 711. doi: 10.1002/sia.6211.


Evaluating activation barrier of Ag hopping on Cu(111)

Author: Sharad Maheshwari

Introduction

Surface diffusion can play an important role in creating a topological modification on the surface as in the case of nanoparticle growth. In the following work we aim to identify the kinetic barrier for the diffusion of a Silver (Ag) atom as it hops from a three-fold fcc site to the adjacent three-fold hcp site on (111) surface of Copper (Cu). We will use density functional theory-based methods to evaluate the activation barrier for the hopping process. We will also calculate the frequency of this hopping process.

Calculation Details

Electronic Calculations

Electronic structure calculations were performed using the Vienna Ab initio Simulation Package (VASP)[1, 2] a plane wave basis set pseudo-potential code. We used the projector augmented wave (PAW) [3] method for core-valence treatment. The exchange and correlation energies were calculated using the Perdew, Burke, and Ernzerhof (PBE) [4] functional described within the generalized gradient approximation (GGA) [5]. A plane-wave basis set cutoff energy of 450 eV was used. The ionic convergence limit was set to 0.01 eV Å-1 while the electronic convergence limit was set to 10-5 eV. The Fermi level was smeared with the Methfessel-Paxton [6] scheme using a smearing width (σ) of 0.2 eV.

Surface Model

A 3 x 3 surface slab model was used to construct periodic surfaces of Cu (111) using an experimental bulk lattice constant of 2.556 Å. The slab models were comprised of 4 layers of metal atoms.  The top two layers of the slab along with the adsorbate were allowed to relax until the force on atoms in these layers was within 0.01 eV Å-1 while the bottom two layers were kept fixed to imitate their bulk arrangement.  A vacuum region of 10 Å was inserted in the models to exclude periodic interaction between the slabs. Dipole corrections were also added in the direction normal to the surface.

The sampling of the Brillouin zone for all 3 x 3 surface cells was conducted with a k-point mesh of 5 x5 x 1 generated automatically using the Monkhorst Pack method[7]

Transition States

To locate the transition state, a series of 5 linearly interpolated images were formed between the reactant and the product state. The nudged elastic band method (NEB) [8] was used to locate the transition state. Once an approximate transition state was obtained, it was further refined using the climbing image nudged elastic band method (CI-NEB) [9]. Vibrational frequency calculations were then performed using IBRION = 7 in VASP to confirm the transition state found the first order saddle point. It was further ensured that the single imaginary frequency obtained was along the reaction pathway.

Results

Figure 1 illustrates the reactant, transition and product state for the hopping of Ag atom from the fcc to hcp site of Cu(111) surface. The activation barrier for the hopping process is 0.035 eV.

Figure 1. Top and Side view of the a) reactant b) transition c) product states for the Ag hopping from fcc site to the hcp site on Cu (111)

For the barrier evaluated using the CI-NEB method, the reactant and the product states were used to create a series of images. The energy profile obtained from the calculation for the images is shown below in Figure 2. (All energies are referenced to the reactant state and does not include zero- point vibrational energy corrections).

Figure 2. Reaction energy diagram for the hopping of Ag atom from fcc to hcp site on Cu(111)

One important thing that was observed in a trial calculation is that the NEB method missed the transition state when 4 linearly interpolated intermediate images were used as shown in Figure 3. Using small even number of images can result in missing the saddle point and thus if using the NEB method, a higher density of images are needed near the saddle point. This highlights the need for caution when evaluating the activation barrier using the NEB method and using linear interpolation to obtain the images.

Figure 3. Reaction energy diagram obtained from the calculations using NEB method with 4 images obtained through linear interpolation

On an absolute scale, the zero-point vibrational energy (ZPVE) corrections were found to be very small. However, as the activation barrier itself is very small, we corrected the activation barrier by including the ZPVE corrections to the initial and the transition state. The corrected activation barrier after including the ZPVE corrections is 0.027 eV.

To evaluate the frequency of this hopping, we use the following equation:


where υi and υi†  are the frequencies evaluated for reactant and transition state respectively, kB is the Boltzmann’s constant, ΔEact is the evaluated activation barrier and T is the temperature in Kelvin.  As the transition state is first-order saddle point, it is energy minimum in all direction except for the reaction coordinate, along which it is maximum. Figure 4 shows the hopping frequency of Ag atom from fcc to hcp site on Cu(111) surface at different temperatures.

Figure 4. Frequency of hopping of Ag atom from fcc to hcp site on Cu(111) surface as a function of temperature

Conclusion

We used DFT methods to estimate the kinetic barrier for the hopping of Ag atom from the fcc to hcp site on Cu(111) surface. The activation barrier for this process after including the ZPVE corrections is found to be 0.027 eV. The value found is in reasonable agreement with the reported values [10]. This work illustrates the DFT methods can be used to evaluate kinetic parameters of the process. It also highlights that while using methods to evaluate the activation barrier, one should be careful and must ensure that the transition state found is the correct transition state. Vibrational calculations must be performed and a single imaginary frequency along the reaction coordinate must be confirmed to ensure that the transition state found is indeed the transition state we were looking for.


References

[1] G. Kresse, J. Furthmuller, Efficiency of ab-initio total energy calculations for metals and semiconductors using a plane-wave basis set, Comput. Mater. Sci., 6 (1996) 15-50.

[2] G. Kresse, J. Furthmuller, Efficient iterative schemes for ab initio total-energy calculations using a plane-wave basis set, Phys. Rev. B, 54 (1996) 11169-11186.

[3] G. Kresse, D. Joubert, From ultrasoft pseudopotentials to the projector augmented-wave method, Phys. Rev. B, 59 (1999) 1758-1775.

[4] J.P. Perdew, K. Burke, M. Ernzerhof, Generalized gradient approximation made simple, Phys. Rev. Lett., 77 (1996) 3865-3868.

[5] J.P. Perdew, J.A. Chevary, S.H. Vosko, K.A. Jackson, M.R. Pederson, D.J. Singh, C. Fiolhais, Atoms, Molecules, Solids, And Surfaces – Applications of the Generalized Gradient Approximation for Exchange and Correlation, Phys. Rev. B, 46 (1992) 6671-6687.

[6] M. Methfessel, A.T. Paxton, High-precision sampling for Brillouin-zone integration in metals, Physical Review B, 40 (1989) 3616-3621.

[7] H.J. Monkhorst, J.D. Pack, Special Points for Brillouin-Zone Integrations, Phys. Rev. B, 13 (1976) 5188-5192.

[8] G. Henkelman, H. Jónsson, Improved tangent estimate in the nudged elastic band method for finding minimum energy paths and saddle points, The Journal of Chemical Physics, 113 (2000) 9978-9985.

[9]  G. Henkelman, B.P. Uberuaga, H. Jónsson, A climbing image nudged elastic band method for finding saddle points and minimum energy paths, The Journal of Chemical Physics, 113 (2000) 9901-9904.

[10] Kotri, E. El koraychy, M. Mazroui, Y. Boughaleb, Static investigation of adsorption and hetero-diffusion of copper, silver, and gold adatoms on the (111) surface, Surface and Interface Analysis, 49 (2017) 705-711.