“At today’s rate, by 2025, one in two children will be autistic.”
-Stephanie Seneff, PhD
That’s right, you read correctly. In just 10 years, the rate of autism will increase from 1/150 children to 1/2…or so MIT senior research scientist Stephanie Seneff says. Seneff has concluded that Autism is directly related to the consumption of glyphosate. Glyphosate is a well known and commonly used herbicide used to kill weeds and other pest plants. Seneff claims that children with autism exhibit biomarkers that indicate the presence of excessive amounts of glyphosate, including “…zinc and iron deficiency, low serum sulfate, seizures, and mitochondrial disorder” (Seneff). The most recognized means of glyphosate consumption: GMO’s. GMO stands for Genetically Modified Organism, and many every day foods are being genetically modified. So does the consumption of GMO’s directly result in an increased chance of autism? This blog will disprove that claim by maintaining that correlation does NOT equal causation and exploring the ever-changing standards for autism.
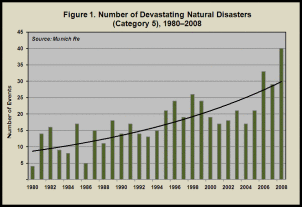
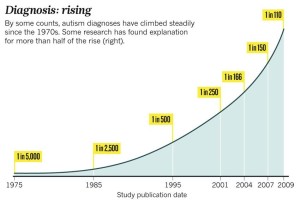
Seneff claims in her original report that “the side effects of autism closely mimic those of glyphosate toxicity”. (Seneff) The two may very well mimic each other, but again this does not identify any direct causation between the two. The rise in glyphosate use does increase at a similar rate as the rise in autism. Both are steadily increasing. However, this does not mean that the two are related in any way. If Seneff is basing her claims on the correlation of graphs, she could also state that an increase in the amount of homelessness in New York City could be increasing autism, or that the steady rise in natural disasters is leading to the similar increase in the rate of autism.
These are graphs analyzing the changes in homelessness, natural disasters, and autism. Look pretty similar?
Again, we cannot assume two things correlate based on similar behavior. Showing their similarities does not exhibit enough proof to show a relation. Correlation does NOT equal causation.
What constitutes the diagnosis for autism has been changing and expanding for decades. More and more forms of autism are being recognized and established. Tara Haelle reported in Forbes magazine that: “the diagnostic criteria for autism expanded in 1994 to include a spectrum of disorders with a broader list of symptoms, thereby widening the definition of autism” (Haelle). If you think about it, if the basis for what defines autism is increased, there will obviously be more cases of it. Say there were 10 kinds of autism in year X, and that resulted in 100 diagnoses’ of ranging types of autism. But then in year Y there are 20 types of autism identified, and that results in 200 diagnoses’. Obviously the chances of having autism increase by a large amount. Theoretically if what constituted autism remained the same within the timeframe that the consumption of GMO’s has been increasing, there would not be an argument that they correlate. If there were a clear and rigid standard for autism that did not change over time, the consumption of GMO’s would increase without the similar increase in autism, erasing the link between the two. The ever-increasing basis of classifying autism feeds directly into Seneff’s argument that this growth is associated with the rising consumption of GMO’s. But this is so only because hundreds of new disorders are falling under the broad category of autism, showing two similar patterns that are actually unrelated.
If you are debating on whether to believe Dr. Seneff’s report, just remember that genetically modified organisms and autism correlates, but that certainly does not mean there is any causation between the two. Also, there is an ever-changing standard for what defines autism as time goes on, which is what is increasing the chances of autism, not GMO consumption. In summary, correlation does NOT equal causation in this case.
Link to original report: http://www.mdpi.com/1099-4300/15/4/1416/pdf
0
0
1
589
3363
Penn State University
28
7
3945
14.0
Normal
0
false
false
false
EN-US
JA
X-NONE
/* Style Definitions */
table.MsoNormalTable
{mso-style-name:”Table Normal”;
mso-tstyle-rowband-size:0;
mso-tstyle-colband-size:0;
mso-style-noshow:yes;
mso-style-priority:99;
mso-style-parent:””;
mso-padding-alt:0in 5.4pt 0in 5.4pt;
mso-para-margin:0in;
mso-para-margin-bottom:.0001pt;
mso-pagination:widow-orphan;
font-size:12.0pt;
font-family:Cambria;
mso-ascii-font-family:Cambria;
mso-ascii-theme-font:minor-latin;
mso-hansi-font-family:Cambria;
mso-hansi-theme-font:minor-latin;}


